1
2
➢ ➢ ➢ ➢ ➢ ➢ 3

3 MW 60 MW 60 MW 110 MW 195 MW 245 MW 30 MW 50 MW 50 MW 0.3 EH/s 2.0 EH/s 3.3 EH/s 5.5 EH/s 10.0 EH/s 13.1 EH/s 0.0 EH/s 2.0 EH/s 4.0 EH/s 6.0 EH/s 8.0 EH/s 10.0 EH/s 12.0 EH/s 14.0 EH/s 0 MW 50 MW 100 MW 150 MW 200 MW 250 MW 300 MW 350 MW 400 MW 1H 2022 2H 2022 1H 2023 2H 2023 3Q 2024 1Q 2025E LMD Mining Nautilus Mining Total Hash Rate Our Operations ➢ Scalable Infrastructure: 750 MW of rapidly scalable capacity ➢ Sustainable Energy: located in region with 91% zero-carbon energy production. ➢ Low-Cost Bitcoin Production: industry- leading efficiency for profitable mining. ➢ Accelerating HPC Hosting: rapid growth in HPC hosting capabilities. Our Strategy ➢ 10 EH/s deployed in Q3 2024 ➢ 555 BTC mined in Q3 2024 981 BTC mined in Q3 2023 ➢ Realized $0.032/kWh power cost in 2023 ➢ Target $0.035/kWh power cost in 2024 ➢ Predominantly zero-carbon energy sources (1) Track Record of Execution Rapidly scaling since inception with significant owned capacity for growth 4 (2) (1) Source: “Power Trends 2024,” published by the New York Independent System Operator (NYISO). (2) Nautilus was sold on October 2, 2024. Sale proceeds comprised of $85 million cash consideration, the return of $1.3 million of working capital, and approximately $7 million worth of Talen contributed miners and related equipment.
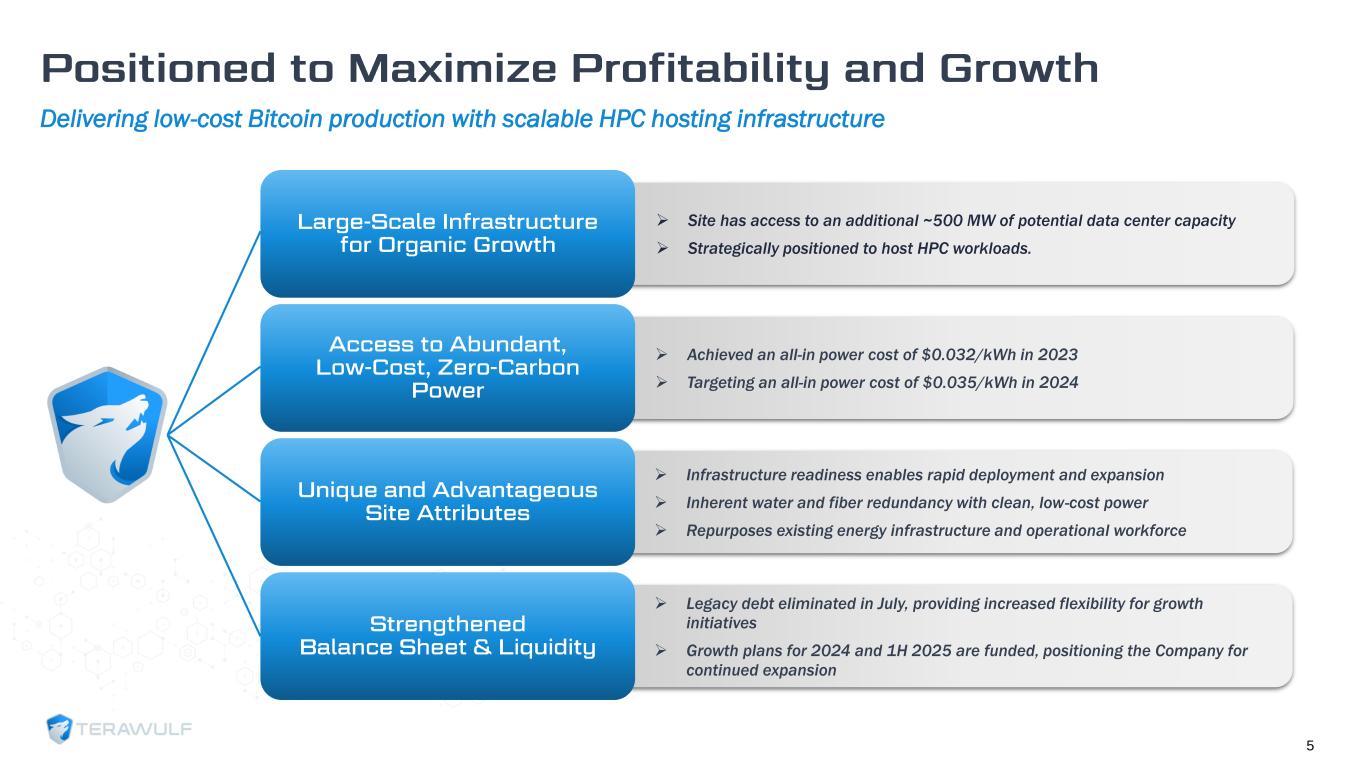
Delivering low-cost Bitcoin production with scalable HPC hosting infrastructure ➢ Site has access to an additional ~500 MW of potential data center capacity ➢ Strategically positioned to host HPC workloads. ➢ Achieved an all-in power cost of $0.032/kWh in 2023 ➢ Targeting an all-in power cost of $0.035/kWh in 2024 ➢ Infrastructure readiness enables rapid deployment and expansion ➢ Inherent water and fiber redundancy with clean, low-cost power ➢ Repurposes existing energy infrastructure and operational workforce ➢ Legacy debt eliminated in July, providing increased flexibility for growth initiatives ➢ Growth plans for 2024 and 1H 2025 are funded, positioning the Company for continued expansion 5
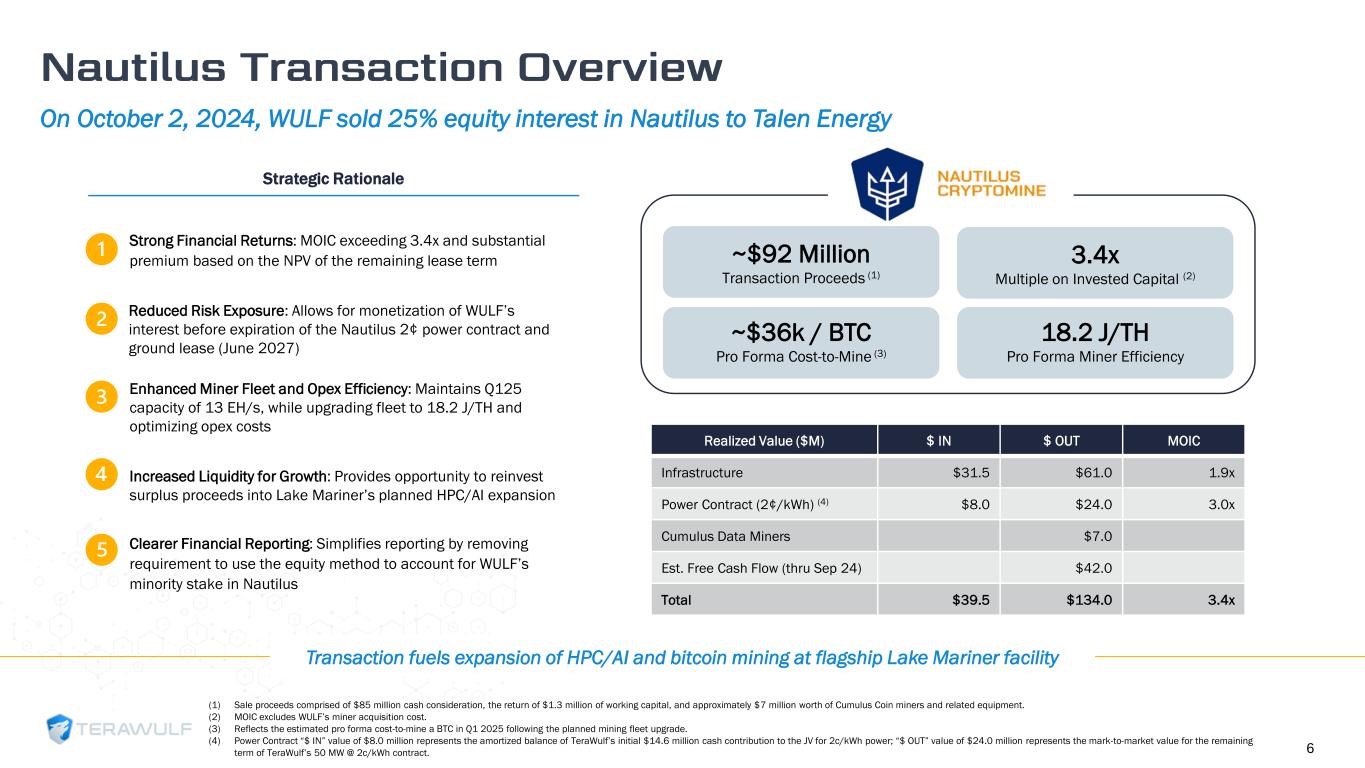
Strong Financial Returns: MOIC exceeding 3.4x and substantial premium based on the NPV of the remaining lease term Reduced Risk Exposure: Allows for monetization of WULF’s interest before expiration of the Nautilus 2¢ power contract and ground lease (June 2027) Enhanced Miner Fleet and Opex Efficiency: Maintains Q125 capacity of 13 EH/s, while upgrading fleet to 18.2 J/TH and optimizing opex costs Increased Liquidity for Growth: Provides opportunity to reinvest surplus proceeds into Lake Mariner’s planned HPC/AI expansion Clearer Financial Reporting: Simplifies reporting by removing requirement to use the equity method to account for WULF’s minority stake in Nautilus Strategic Rationale Realized Value ($M) $ IN $ OUT MOIC Infrastructure $31.5 $61.0 1.9x Power Contract (2¢/kWh) (4) $8.0 $24.0 3.0x Cumulus Data Miners $7.0 Est. Free Cash Flow (thru Sep 24) $42.0 Total $39.5 $134.0 3.4x ~$92 Million Transaction Proceeds (1) ~$36k / BTC Pro Forma Cost-to-Mine (3) 3.4x Multiple on Invested Capital (2) 18.2 J/TH Pro Forma Miner Efficiency (1) Sale proceeds comprised of $85 million cash consideration, the return of $1.3 million of working capital, and approximately $7 million worth of Cumulus Coin miners and related equipment. (2) MOIC excludes WULF’s miner acquisition cost. (3) Reflects the estimated pro forma cost-to-mine a BTC in Q1 2025 following the planned mining fleet upgrade. (4) Power Contract “$ IN” value of $8.0 million represents the amortized balance of TeraWulf’s initial $14.6 million cash contribution to the JV for 2c/kWh power; “$ OUT” value of $24.0 million represents the mark-to-market value for the remaining term of TeraWulf’s 50 MW @ 2c/kWh contract. On October 2, 2024, WULF sold 25% equity interest in Nautilus to Talen Energy Transaction fuels expansion of HPC/AI and bitcoin mining at flagship Lake Mariner facility 6
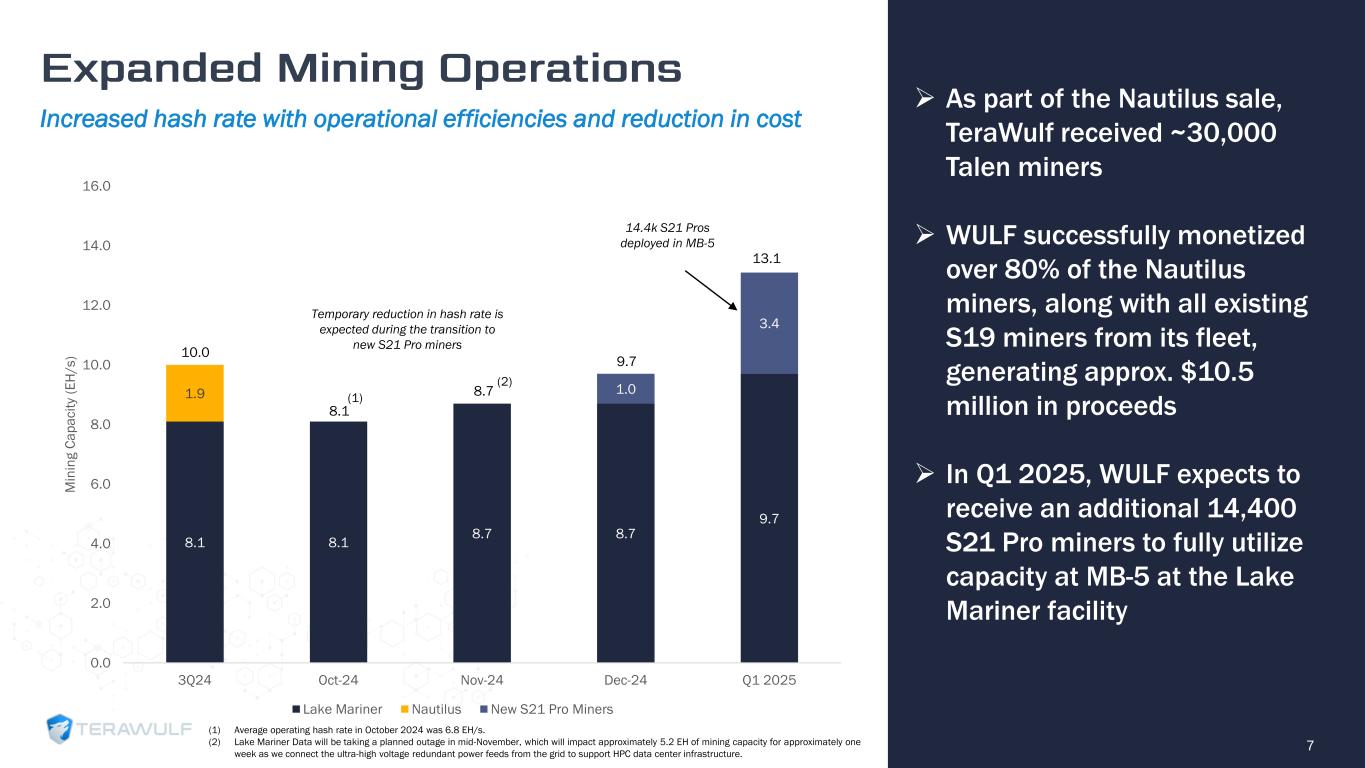
7 ➢ As part of the Nautilus sale, TeraWulf received ~30,000 Talen miners ➢ WULF successfully monetized over 80% of the Nautilus miners, along with all existing S19 miners from its fleet, generating approx. $10.5 million in proceeds ➢ In Q1 2025, WULF expects to receive an additional 14,400 S21 Pro miners to fully utilize capacity at MB-5 at the Lake Mariner facility Increased hash rate with operational efficiencies and reduction in cost 8.1 8.1 8.7 8.7 9.7 1.9 1.0 3.4 0.0 2.0 4.0 6.0 8.0 10.0 12.0 14.0 16.0 3Q24 Oct-24 Nov-24 Dec-24 Q1 2025 M in in g C a p a c it y (E H / s ) Lake Mariner Nautilus New S21 Pro Miners 10.0 8.1 8.7 9.7 13.1 Temporary reduction in hash rate is expected during the transition to new S21 Pro miners 14.4k S21 Pros deployed in MB-5 (1) Average operating hash rate in October 2024 was 6.8 EH/s. (2) Lake Mariner Data will be taking a planned outage in mid-November, which will impact approximately 5.2 EH of mining capacity for approximately one week as we connect the ultra-high voltage redundant power feeds from the grid to support HPC data center infrastructure. (2) (1)
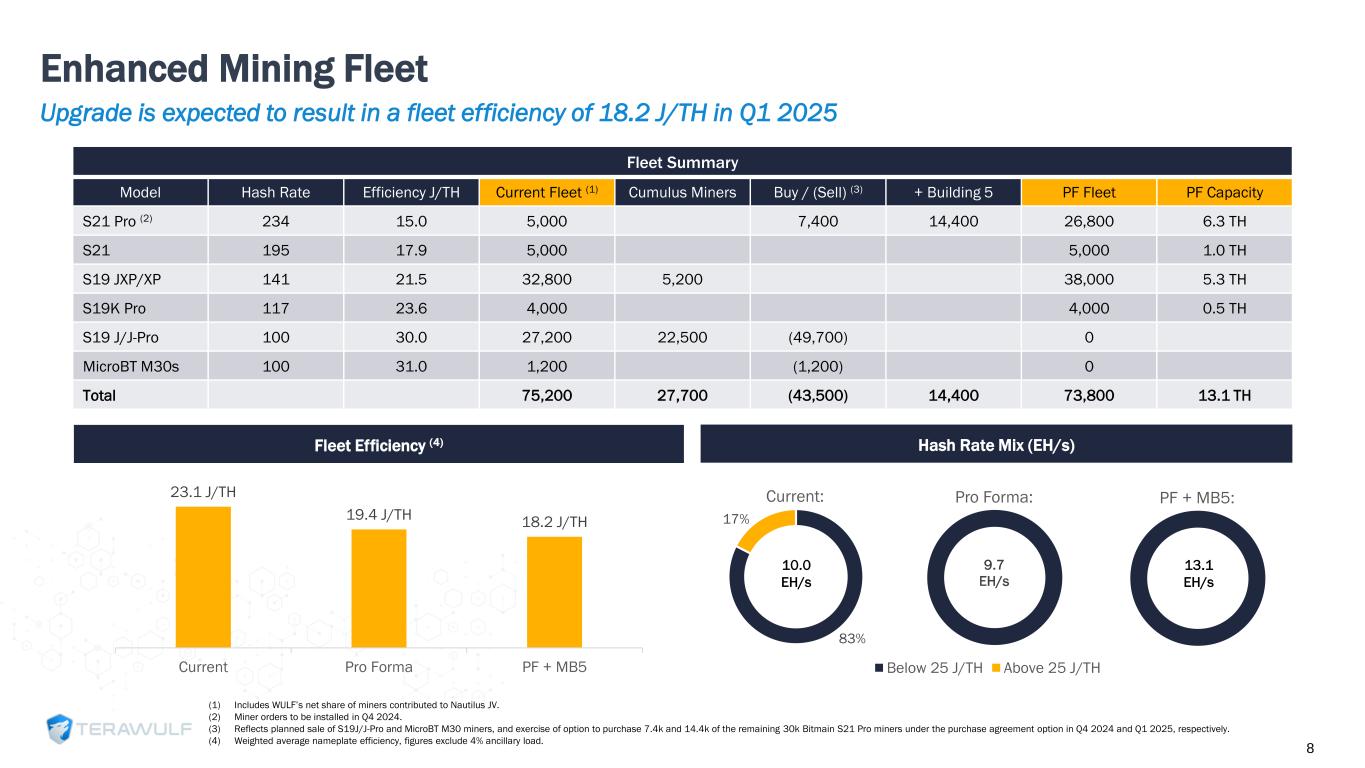
Enhanced Mining Fleet (1) Includes WULF’s net share of miners contributed to Nautilus JV. (2) Miner orders to be installed in Q4 2024. (3) Reflects planned sale of S19J/J-Pro and MicroBT M30 miners, and exercise of option to purchase 7.4k and 14.4k of the remaining 30k Bitmain S21 Pro miners under the purchase agreement option in Q4 2024 and Q1 2025, respectively. (4) Weighted average nameplate efficiency, figures exclude 4% ancillary load. Fleet Summary Model Hash Rate Efficiency J/TH Current Fleet (1) Cumulus Miners Buy / (Sell) (3) + Building 5 PF Fleet PF Capacity S21 Pro (2) 234 15.0 5,000 7,400 14,400 26,800 6.3 TH S21 195 17.9 5,000 5,000 1.0 TH S19 JXP/XP 141 21.5 32,800 5,200 38,000 5.3 TH S19K Pro 117 23.6 4,000 4,000 0.5 TH S19 J/J-Pro 100 30.0 27,200 22,500 (49,700) 0 MicroBT M30s 100 31.0 1,200 (1,200) 0 Total 75,200 27,700 (43,500) 14,400 73,800 13.1 TH Fleet Efficiency (4) Hash Rate Mix (EH/s) 83% 17% Current: 9.7 EH/s Pro Forma: Below 25 J/TH Above 25 J/TH 10.0 EH/s PF + MB5: 13.1 EH/s 8 23.1 J/TH 19.4 J/TH 18.2 J/TH Current Pro Forma PF + MB5 Upgrade is expected to result in a fleet efficiency of 18.2 J/TH in Q1 2025

Positive EBITDA and cash flow generation despite a difficult operating environment 9 Metric Amount Comments End of Period Hash Rate 10.0 EH/s ➢ 100% increase year-over-year in self-mining hash rate Bitcoin Self-mined 555 ➢ 6.0 BTC per day Power Cost $0.038/kWh ➢ Represents power cost per BTC of $30,448 Revenue (1) $27.1 million ➢ 43% increase year-over-year; value per BTC self-mined (non-GAAP) averaged ~$61k(2)(3) Non-GAAP Adjusted EBITDA (2) $5.9 million ➢ EBITDA/EH of $0.6 million Cash and Cash Equivalents $23.9 million ➢ Excludes BTC of $0.3 million (4) Net Debt (5) $(23.9) million ➢ Debt fully repaid in July 2024 (1) GAAP measure; excludes Nautilus JV. (2) Computed as the weighted average opening price of BTC on each respective day the self-mined BTC is earned. (3) Non-GAAP measure; includes Nautilus JV. (4) Based on the closing market price per one Bitcoin of $63,301 on September 30, 2024. (5) Net Debt as of September 30, 2024, reflects no debt and $23.9 million of cash.
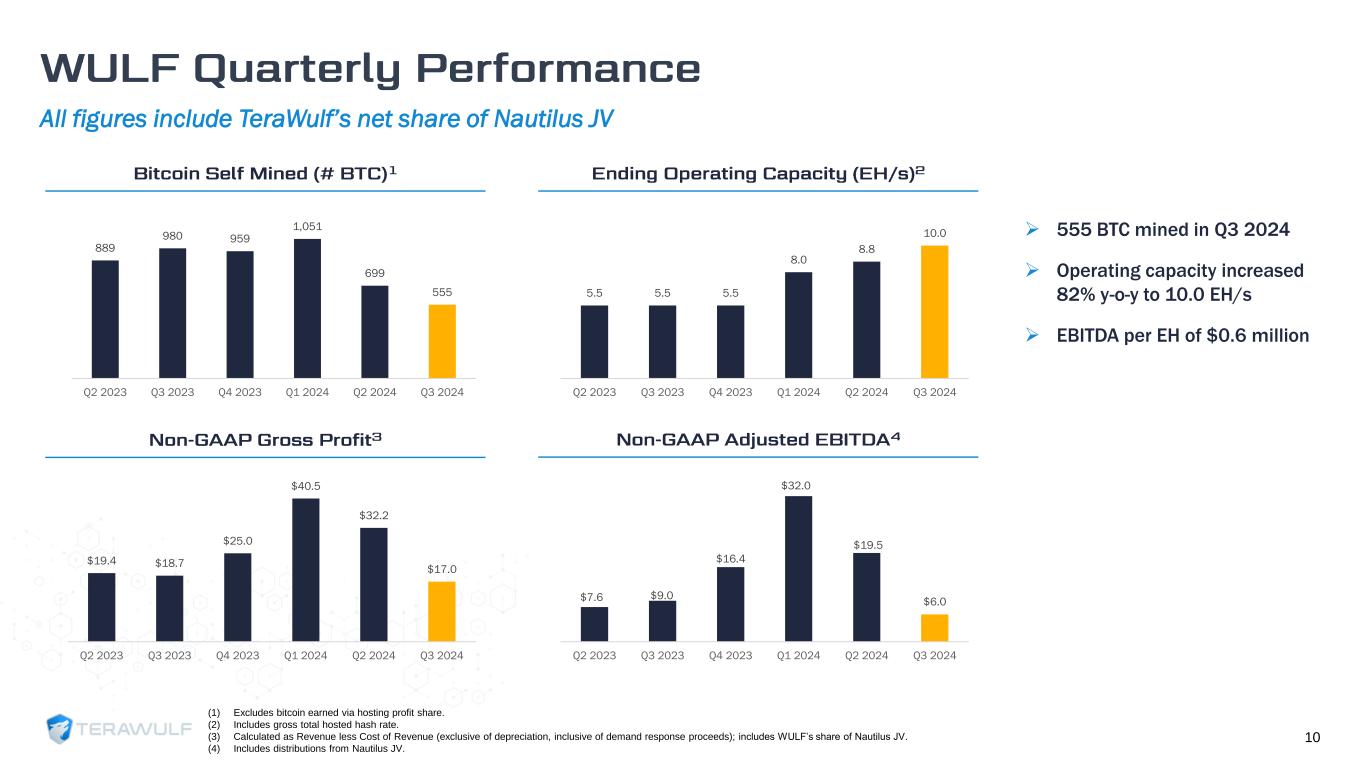
All figures include TeraWulf’s net share of Nautilus JV 10 889 980 959 1,051 699 555 Q2 2023 Q3 2023 Q4 2023 Q1 2024 Q2 2024 Q3 2024 5.5 5.5 5.5 8.0 8.8 10.0 Q2 2023 Q3 2023 Q4 2023 Q1 2024 Q2 2024 Q3 2024 $19.4 $18.7 $25.0 $40.5 $32.2 $17.0 Q2 2023 Q3 2023 Q4 2023 Q1 2024 Q2 2024 Q3 2024 $7.6 $9.0 $16.4 $32.0 $19.5 $6.0 Q2 2023 Q3 2023 Q4 2023 Q1 2024 Q2 2024 Q3 2024 (1) Excludes bitcoin earned via hosting profit share. (2) Includes gross total hosted hash rate. (3) Calculated as Revenue less Cost of Revenue (exclusive of depreciation, inclusive of demand response proceeds); includes WULF’s share of Nautilus JV. (4) Includes distributions from Nautilus JV. ➢ 555 BTC mined in Q3 2024 ➢ Operating capacity increased 82% y-o-y to 10.0 EH/s ➢ EBITDA per EH of $0.6 million

11 Net shares Issued Upon Conversion (Grey Shaded Zone is Provisionally Callable by Company) $500.0mm Deal Size at 2.75% coupon up 32.50% Conversion Premium with up 100.0% Capped Call Overlay + $115mm share repurchase (in Millions) (18) (18) (18) (18) (13) (6) 0 1 3 5 (5.5%) (4.5%) (3.5%) (2.5%) (1.5%) (0.5%) 0.5% 1.5% 2.5% (20.00) (15.00) (10.00) (5.00) 5.00 10.00 $6.40 0.0% $8.48 32.5% $11.02 72.3% $12.80 100.0% $14.00 118.8% $16.00 150.0% $18.41 187.7% $19.00 196.9% $20.00 212.5% $21.00 228.1% % o f TS O Sh ar e s in M il li o n s Conversion Price Upper Strike 100% above Stock Price at Issue Reference Price Four Key Aspects that Minimized Shareholder Dilution from Convertible Notes Offering: ➢ Capped Call Neutralizes dilution until the stock price reaches $12.80 (100% above the reference price) ➢ Concurrent Share Repurchase: Repurchased 17.97 million shares at $6.40 with offering proceeds ➢ Early Call Option After Three Years Company can call notes after November 2027 if the stock hits $11.02 (130% of the conversion price) ➢ Overnight Pricing Execution Priced off an unaffected share price, avoiding typical market declines Together, these strategies mean that WULF will not issue more net shares than were repurchased upon conversion, unless the share price exceeds 188% of the $6.40 reference price, or $18.41 per share Simultaneous Capped Call and $115M Share Repurchase = No Dilution until >$18/share (1) TSO based on 382.60mm shares outstanding per Bloomberg as of October 25. (2) Grey shaded Zone is provisionally callable by company. (3) $500.0mm deal size at 2.75% coupon up 32.5% conversion premium with up 100% capped call overlay +$115mm share repurchase.
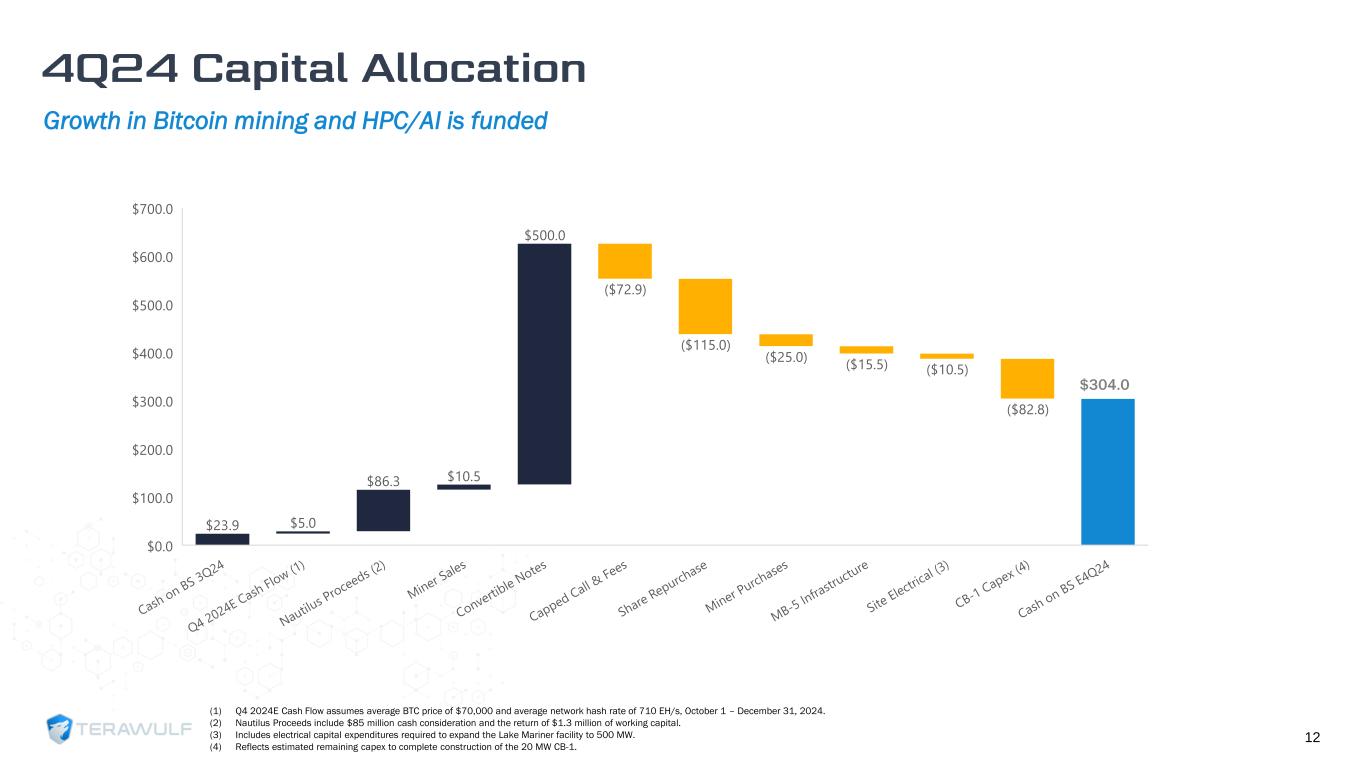
Growth in Bitcoin mining and HPC/AI is funded 12 (1) Q4 2024E Cash Flow assumes average BTC price of $70,000 and average network hash rate of 710 EH/s, October 1 – December 31, 2024. (2) Nautilus Proceeds include $85 million cash consideration and the return of $1.3 million of working capital. (3) Includes electrical capital expenditures required to expand the Lake Mariner facility to 500 MW. (4) Reflects estimated remaining capex to complete construction of the 20 MW CB-1. $304.0

HPC hosting contracts are projected to unlock substantial platform value 13 (1) Estimated 2025E cash from operations assumes: 1) average BTC price of $80,000 and network hash rate of 725 EH/s; 2) 20 MW CB-1 and 50 MW CB-2 operating for 9 months and 6 months, respectively. (2) Estimated HPC Revenue Prepay assumes 1.25 average annual PUE and 12-month revenue prepay for 2.5 MW Wulf Den, 20 MW CB-1 and 50 MW CB-2 at $1.5M per MW. (3) Estimated Project Financing assumes that ~70% of total project costs for Wulf Den, CB-1 and CB-2 are financed. Substantial cash flow available for capital allocation $387.0
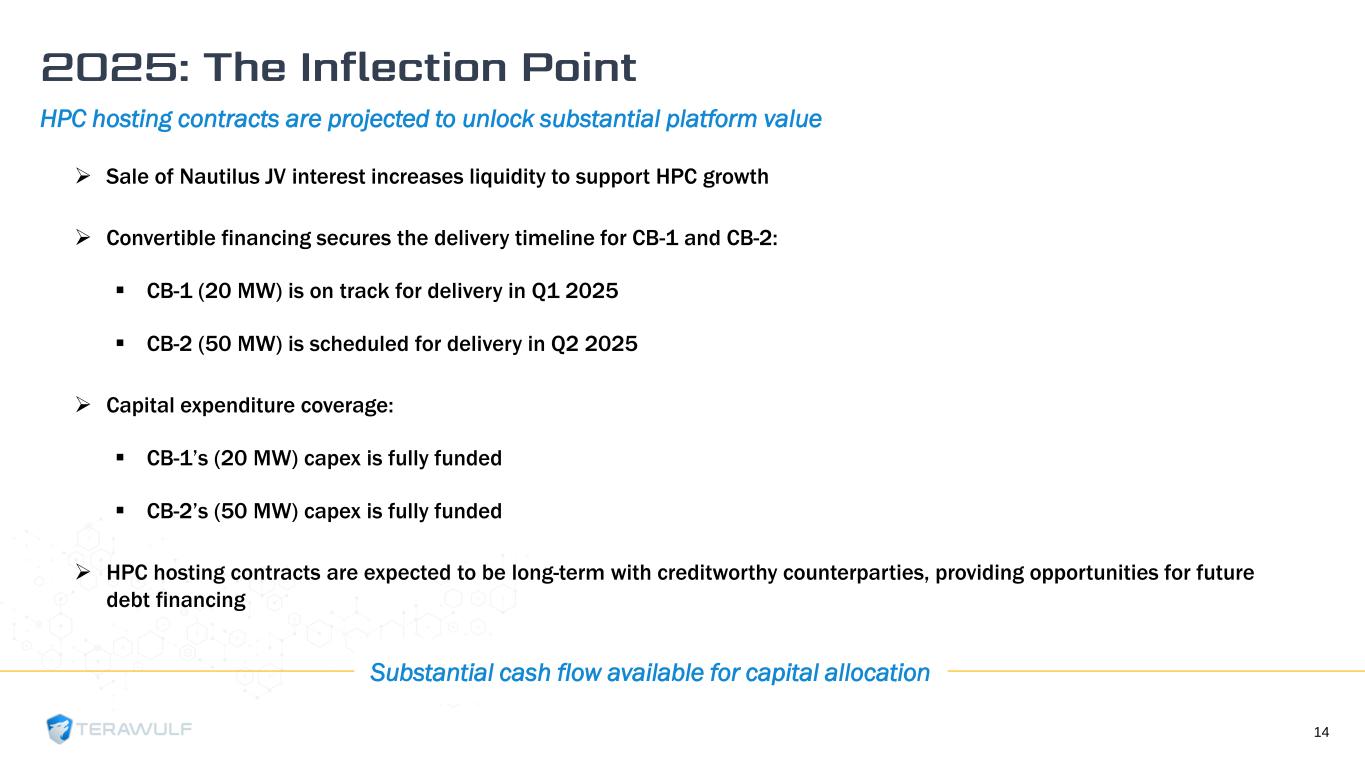
HPC hosting contracts are projected to unlock substantial platform value ➢ Sale of Nautilus JV interest increases liquidity to support HPC growth ➢ Convertible financing secures the delivery timeline for CB-1 and CB-2: ▪ CB-1 (20 MW) is on track for delivery in Q1 2025 ▪ CB-2 (50 MW) is scheduled for delivery in Q2 2025 ➢ Capital expenditure coverage: ▪ CB-1’s (20 MW) capex is fully funded ▪ CB-2’s (50 MW) capex is fully funded ➢ HPC hosting contracts are expected to be long-term with creditworthy counterparties, providing opportunities for future debt financing 14 Substantial cash flow available for capital allocation
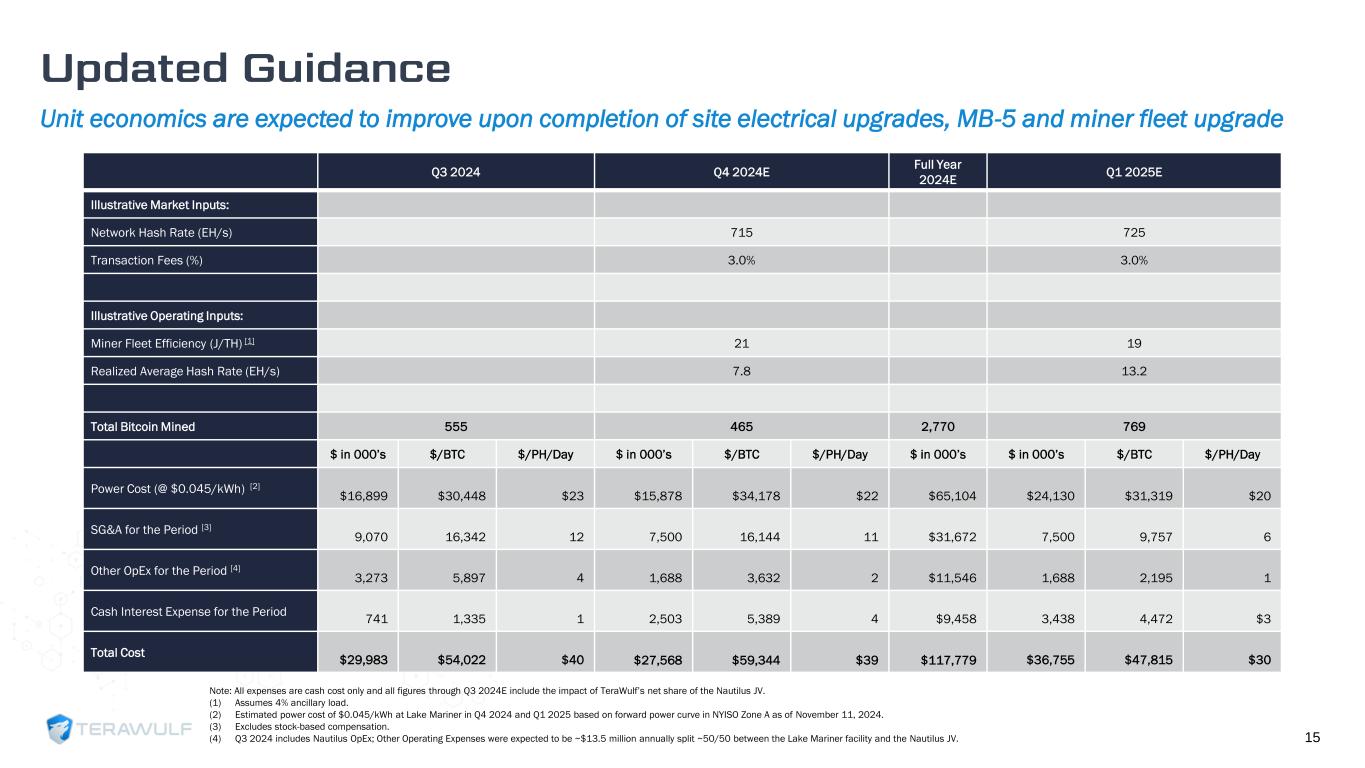
Unit economics are expected to improve upon completion of site electrical upgrades, MB-5 and miner fleet upgrade 15 Q3 2024 Q4 2024E Full Year 2024E Q1 2025E Illustrative Market Inputs: Network Hash Rate (EH/s) 715 725 Transaction Fees (%) 3.0% 3.0% Illustrative Operating Inputs: Miner Fleet Efficiency (J/TH) [1] 21 19 Realized Average Hash Rate (EH/s) 7.8 13.2 Total Bitcoin Mined 555 465 2,770 769 $ in 000’s $/BTC $/PH/Day $ in 000’s $/BTC $/PH/Day $ in 000’s $ in 000’s $/BTC $/PH/Day Power Cost (@ $0.045/kWh) [2] $16,899 $30,448 $23 $15,878 $34,178 $22 $65,104 $24,130 $31,319 $20 SG&A for the Period [3] 9,070 16,342 12 7,500 16,144 11 $31,672 7,500 9,757 6 Other OpEx for the Period [4] 3,273 5,897 4 1,688 3,632 2 $11,546 1,688 2,195 1 Cash Interest Expense for the Period 741 1,335 1 2,503 5,389 4 $9,458 3,438 4,472 $3 Total Cost $29,983 $54,022 $40 $27,568 $59,344 $39 $117,779 $36,755 $47,815 $30 Note: All expenses are cash cost only and all figures through Q3 2024E include the impact of TeraWulf’s net share of the Nautilus JV. (1) Assumes 4% ancillary load. (2) Estimated power cost of $0.045/kWh at Lake Mariner in Q4 2024 and Q1 2025 based on forward power curve in NYISO Zone A as of November 11, 2024. (3) Excludes stock-based compensation. (4) Q3 2024 includes Nautilus OpEx; Other Operating Expenses were expected to be ~$13.5 million annually split ~50/50 between the Lake Mariner facility and the Nautilus JV.
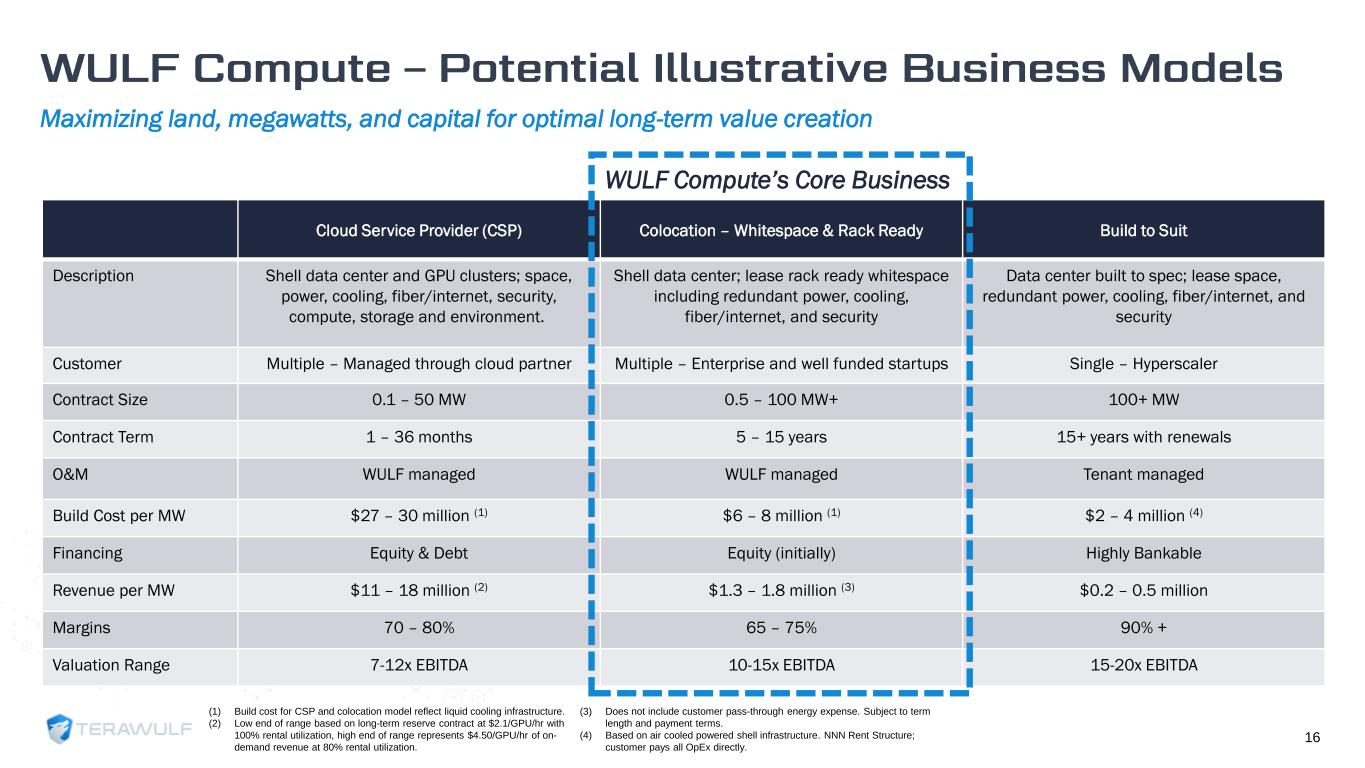
Maximizing land, megawatts, and capital for optimal long-term value creation 16 Cloud Service Provider (CSP) Colocation – Whitespace & Rack Ready Build to Suit Description Shell data center and GPU clusters; space, power, cooling, fiber/internet, security, compute, storage and environment. Shell data center; lease rack ready whitespace including redundant power, cooling, fiber/internet, and security Data center built to spec; lease space, redundant power, cooling, fiber/internet, and security Customer Multiple – Managed through cloud partner Multiple – Enterprise and well funded startups Single – Hyperscaler Contract Size 0.1 – 50 MW 0.5 – 100 MW+ 100+ MW Contract Term 1 – 36 months 5 – 15 years 15+ years with renewals O&M WULF managed WULF managed Tenant managed Build Cost per MW $27 – 30 million (1) $6 – 8 million (1) $2 – 4 million (4) Financing Equity & Debt Equity (initially) Highly Bankable Revenue per MW $11 – 18 million (2) $1.3 – 1.8 million (3) $0.2 – 0.5 million Margins 70 – 80% 65 – 75% 90% + Valuation Range 7-12x EBITDA 10-15x EBITDA 15-20x EBITDA (1) Build cost for CSP and colocation model reflect liquid cooling infrastructure. (2) Low end of range based on long-term reserve contract at $2.1/GPU/hr with 100% rental utilization, high end of range represents $4.50/GPU/hr of on- demand revenue at 80% rental utilization. (3) Does not include customer pass-through energy expense. Subject to term length and payment terms. (4) Based on air cooled powered shell infrastructure. NNN Rent Structure; customer pays all OpEx directly. WULF Compute’s Core Business
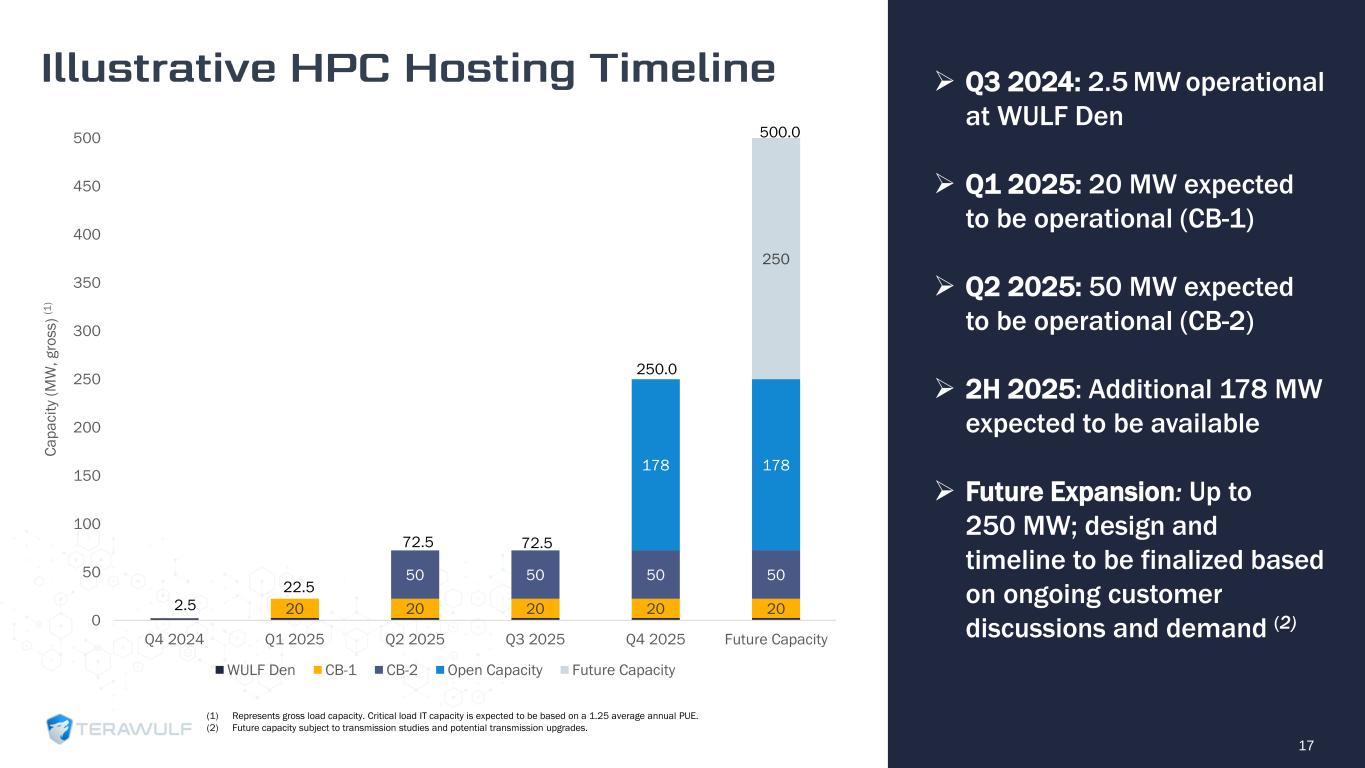
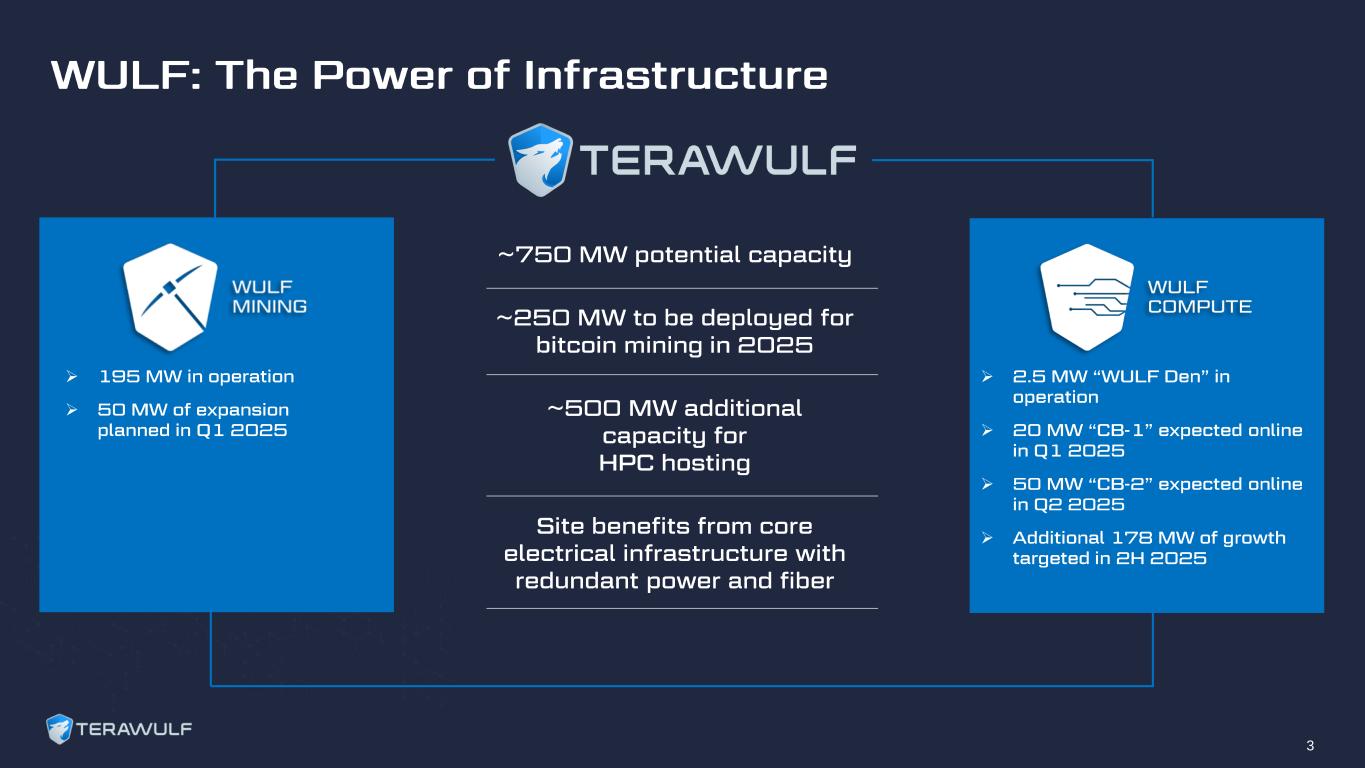
17 ➢ Q3 2024: 2.5 MW operational at WULF Den ➢ Q1 2025: 20 MW expected to be operational (CB-1) ➢ Q2 2025: 50 MW expected to be operational (CB-2) ➢ 2H 2025: Additional 178 MW expected to be available ➢ Future Expansion: Up to 250 MW; design and timeline to be finalized based on ongoing customer discussions and demand (2) (1) Represents gross load capacity. Critical load IT capacity is expected to be based on a 1.25 average annual PUE. (2) Future capacity subject to transmission studies and potential transmission upgrades. 20 20 20 20 20 50 50 50 50 178 178 250 0 50 100 150 200 250 300 350 400 450 500 Q4 2024 Q1 2025 Q2 2025 Q3 2025 Q4 2025 Future Capacity C a p a c it y (M W , g ro s s ) (1 ) WULF Den CB-1 CB-2 Open Capacity Future Capacity 2.5 22.5 72.5 72.5 250.0 500.0

18

N A Z A R K H A N Co-Founder, Chief Operating Officer & Chief Technology Officer 20+ years in energy infrastructure and cryptocurrency mining; previously at Evercore P A U L P R A G E R Co-Founder, Chairman & Chief Executive Officer 30+ year energy infrastructure entrepreneur; USNA Foundation Investment Committee Trustee K E R R I L A N G L A I S Chief Strategy Officer 20+ years of M&A, financing, strategy, and power sector experience; previously at Goldman Sachs S T E F A N I E F L E I S C H M A N N Chief Legal Officer General Counsel for 15+ years overseeing all legal and compliance matters; previously at Paul, Weiss P A T R I C K F L E U R Y Chief Financial Officer 20+ years of financial experience in the energy, power, and commodity sectors; previously at Platinum Equity and Blackstone S E A N F A R R E L L SVP, Operations 13+ years of energy experience in renewables, grid optimization, digitalization, and storage solutions; previously at Siemens Energy J O H N L A R K I N Director of Investor Relations 25+ years of capital markets experience across both buy-side and sell-side positions; previously at Connacht Asset Management Led by an accomplished, diverse management team with 30+ years of experience in developing and managing energy infrastructure and disruptive technology 19
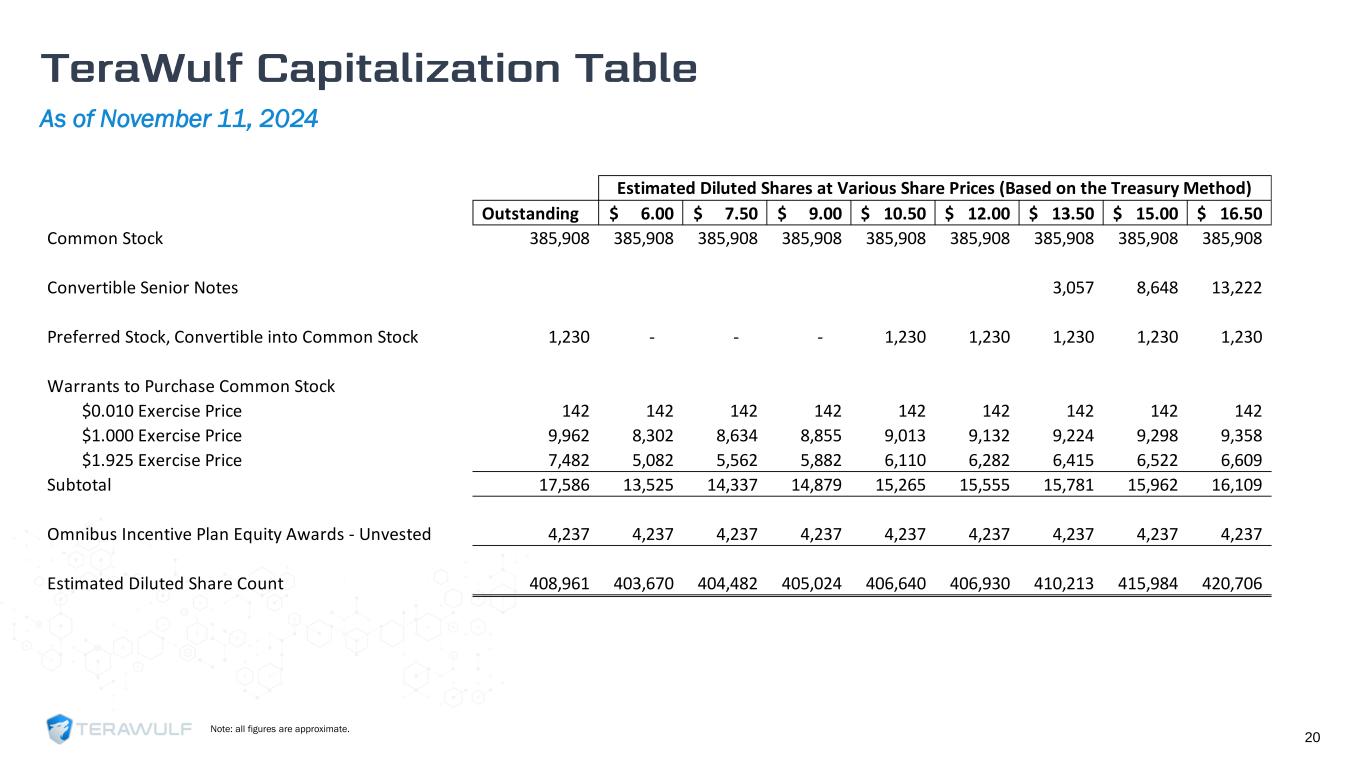
As of November 11, 2024 20 Note: all figures are approximate. Outstanding 6.00$ 7.50$ 9.00$ 10.50$ 12.00$ 13.50$ 15.00$ 16.50$ Common Stock 385,908 385,908 385,908 385,908 385,908 385,908 385,908 385,908 385,908 Convertible Senior Notes 3,057 8,648 13,222 Preferred Stock, Convertible into Common Stock 1,230 - - - 1,230 1,230 1,230 1,230 1,230 Warrants to Purchase Common Stock $0.010 Exercise Price 142 142 142 142 142 142 142 142 142 $1.000 Exercise Price 9,962 8,302 8,634 8,855 9,013 9,132 9,224 9,298 9,358 $1.925 Exercise Price 7,482 5,082 5,562 5,882 6,110 6,282 6,415 6,522 6,609 Subtotal 17,586 13,525 14,337 14,879 15,265 15,555 15,781 15,962 16,109 Omnibus Incentive Plan Equity Awards - Unvested 4,237 4,237 4,237 4,237 4,237 4,237 4,237 4,237 4,237 Estimated Diluted Share Count 408,961 403,670 404,482 405,024 406,640 406,930 410,213 415,984 420,706 Estimated Diluted Shares at Various Share Prices (Based on the Treasury Method)
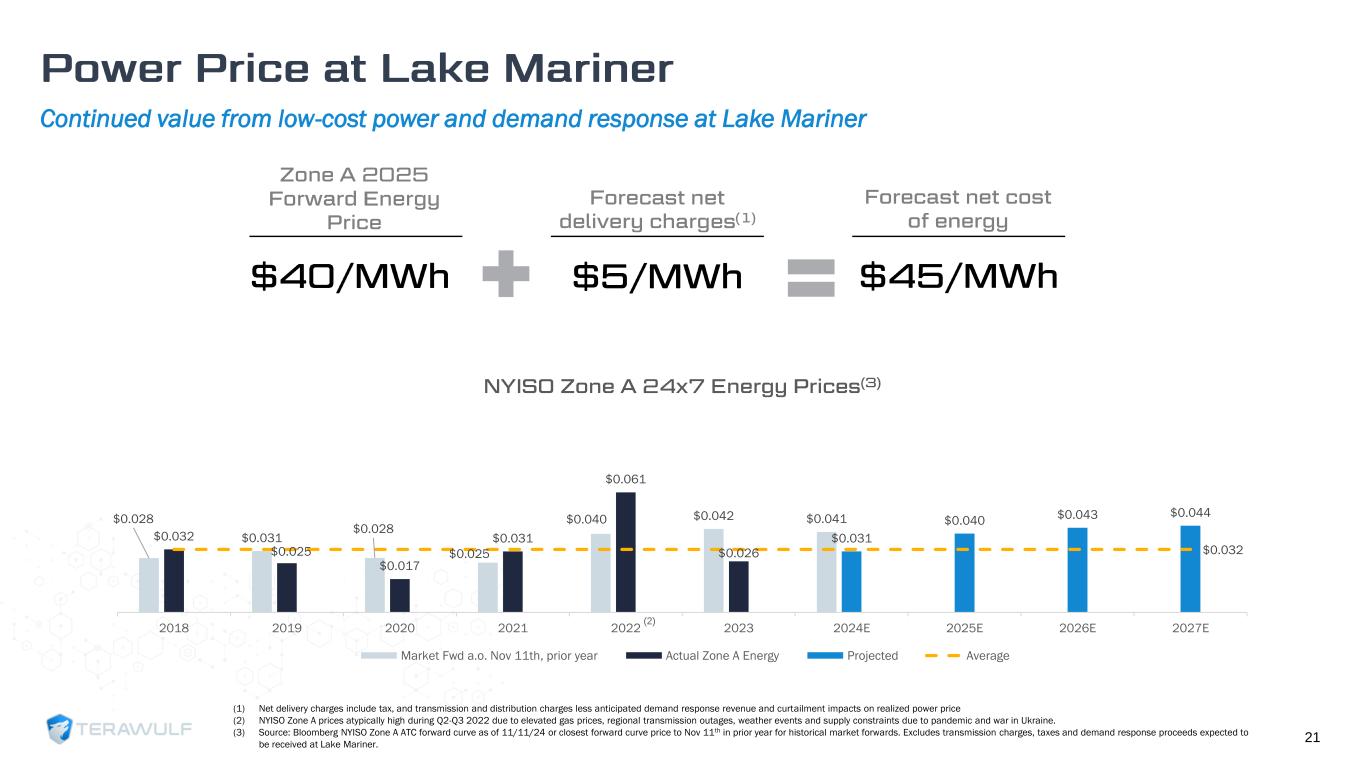
Continued value from low-cost power and demand response at Lake Mariner 21 (1) Net delivery charges include tax, and transmission and distribution charges less anticipated demand response revenue and curtailment impacts on realized power price (2) NYISO Zone A prices atypically high during Q2-Q3 2022 due to elevated gas prices, regional transmission outages, weather events and supply constraints due to pandemic and war in Ukraine. (3) Source: Bloomberg NYISO Zone A ATC forward curve as of 11/11/24 or closest forward curve price to Nov 11th in prior year for historical market forwards. Excludes transmission charges, taxes and demand response proceeds expected to be received at Lake Mariner. (2) $0.028 $0.031 $0.028 $0.025 $0.040 $0.042 $0.041 $0.032 $0.025 $0.017 $0.031 $0.061 $0.026 $0.031 $0.040 $0.043 $0.044 $0.032 2018 2019 2020 2021 2022 2023 2024E 2025E 2026E 2027E Market Fwd a.o. Nov 11th, prior year Actual Zone A Energy Projected Average
22
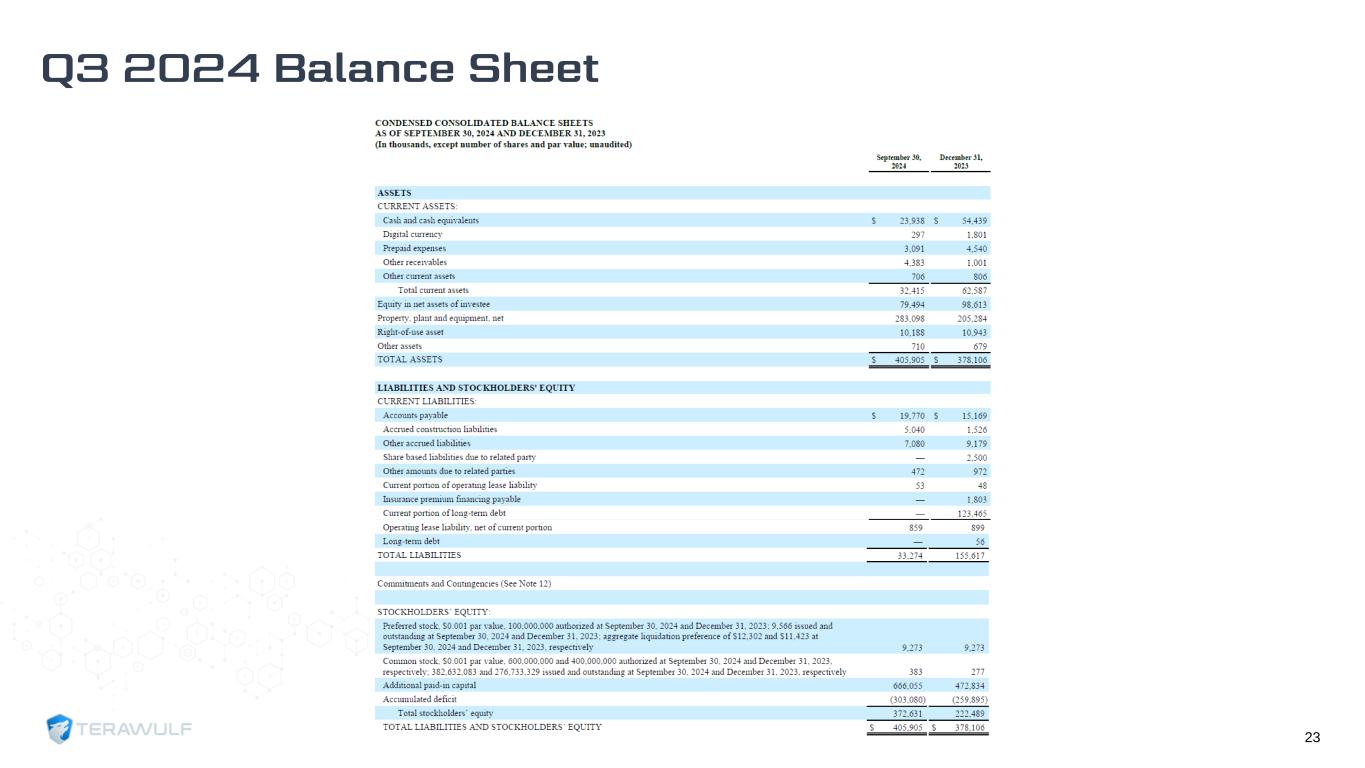
23
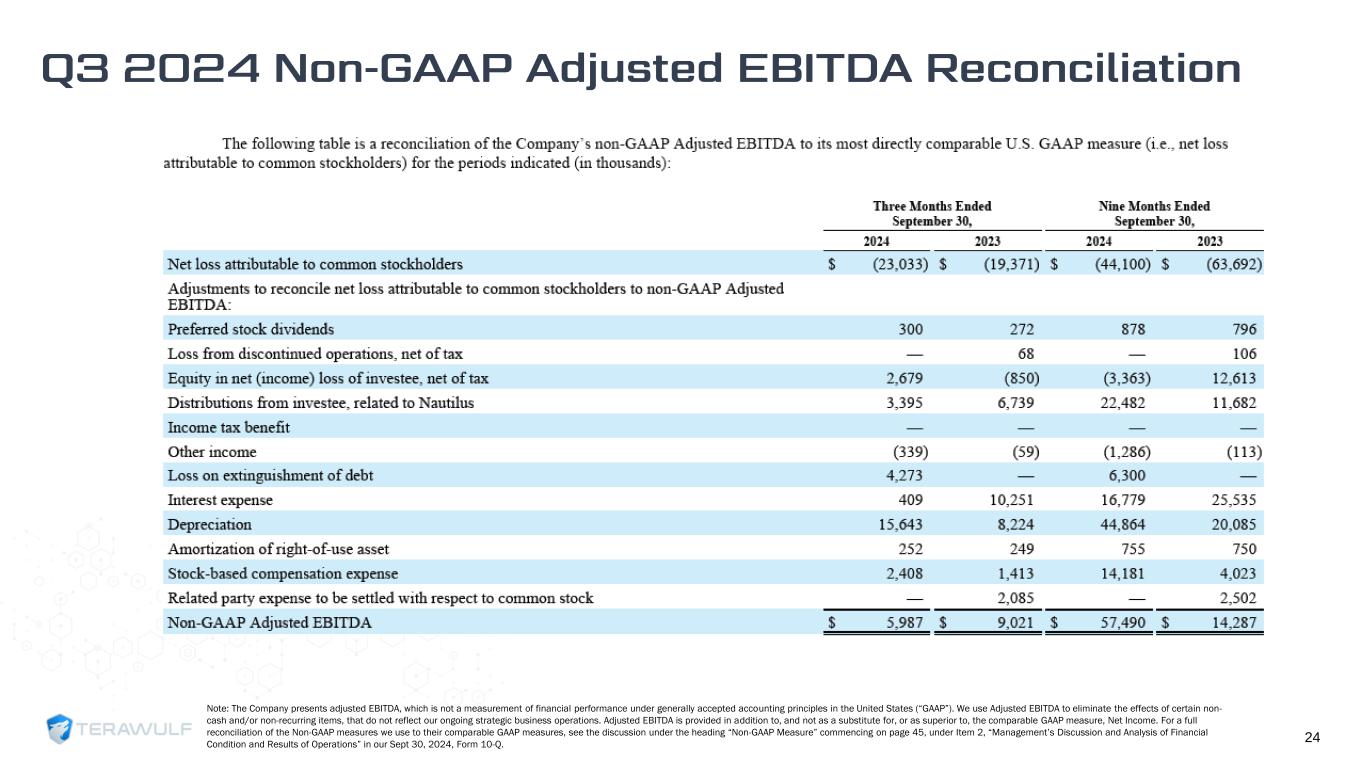
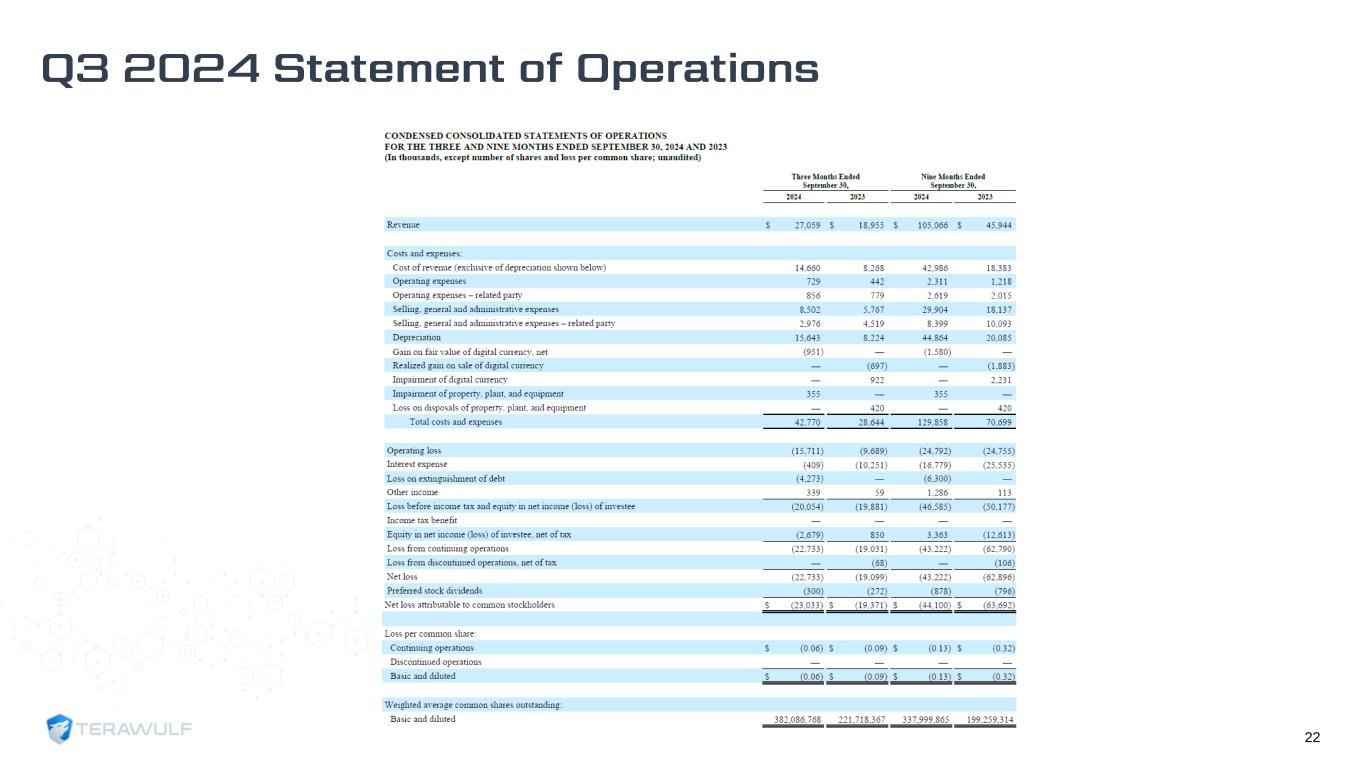
24 Note: The Company presents adjusted EBITDA, which is not a measurement of financial performance under generally accepted accounting principles in the United States (“GAAP”). We use Adjusted EBITDA to eliminate the effects of certain non- cash and/or non-recurring items, that do not reflect our ongoing strategic business operations. Adjusted EBITDA is provided in addition to, and not as a substitute for, or as superior to, the comparable GAAP measure, Net Income. For a full reconciliation of the Non-GAAP measures we use to their comparable GAAP measures, see the discussion under the heading “Non-GAAP Measure” commencing on page 45, under Item 2, “Management’s Discussion and Analysis of Financial Condition and Results of Operations” in our Sept 30, 2024, Form 10-Q.