1 First Quarter 2025 Update May 9, 2025 Moving Infrastructure Forward
SAFE HARBOR STATEMENT This presentation is for informational purposes only and contains forward-looking statements within the meaning of the "safe harbor" provisions of the Private Securities Litigation Reform Act of 1995, as amended. Such forward-looking statements include statements concerning anticipated future events and expectations that are not historical facts. All statements, other than statements of historical fact, are statements that could be deemed forward-looking statements. In addition, forward-looking statements are typically identified by words such as “plan,” “believe,” “goal,” “target,” “aim,” “expect,” “anticipate,” “intend,” “outlook,” “estimate,” “forecast,” “project,” “seek,” “continue,” “could,” “may,” “might,” “possible,” “potential,” “strategy,” “opportunity,” “predict,” “should,” “would” and other similar words and expressions, although the absence of these words or expressions does not mean that a statement is not forward-looking. Forward-looking statements are based on the current expectations and beliefs of TeraWulf’s management and are inherently subject to a number of factors, risks, uncertainties and assumptions and their potential effects. There can be no assurance that future developments will be those that have been anticipated. Actual results may vary materially from those expressed or implied by forward-looking statements based on a number of factors, risks, uncertainties and assumptions, including, among others: (1) the ability to mine bitcoin profitably; (2) our ability to attract additional customers to lease our HPC data centers; (3) our ability to perform under our existing data center lease agreements (4) changes in applicable laws, regulations and/or permits affecting TeraWulf’s operations or the industries in which it operates; (5) the ability to implement certain business objectives, including its bitcoin mining and HPC data center development, and to timely and cost-effectively execute related projects; (6) failure to obtain adequate financing on a timely basis and/or on acceptable terms with regard to expansion or existing operations; (7) adverse geopolitical or economic conditions, including a high inflationary environment, the implementation of new tariffs and more restrictive trade regulations; (8) the potential of cybercrime, money-laundering, malware infections and phishing and/or loss and interference as a result of equipment malfunction or break-down, physical disaster, data security breach, computer malfunction or sabotage (and the costs associated with any of the foregoing); (9) the availability and cost of power as well as electrical infrastructure equipment necessary to maintain and grow the business and operations of TeraWulf; and (10) other risks and uncertainties detailed from time to time in the Company’s filings with the Securities and Exchange Commission (“SEC”). Potential investors, stockholders and other readers are cautioned not to place undue reliance on these forward-looking statements, which speak only as of the date on which they were made. TeraWulf does not assume any obligation to publicly update any forward-looking statement after it was made, whether as a result of new information, future events or otherwise, except as required by law or regulation. Investors are referred to the full discussion of risks and uncertainties associated with forward-looking statements and the discussion of risk factors contained in the Company’s filings with the SEC, which are available at www.sec.gov. 2
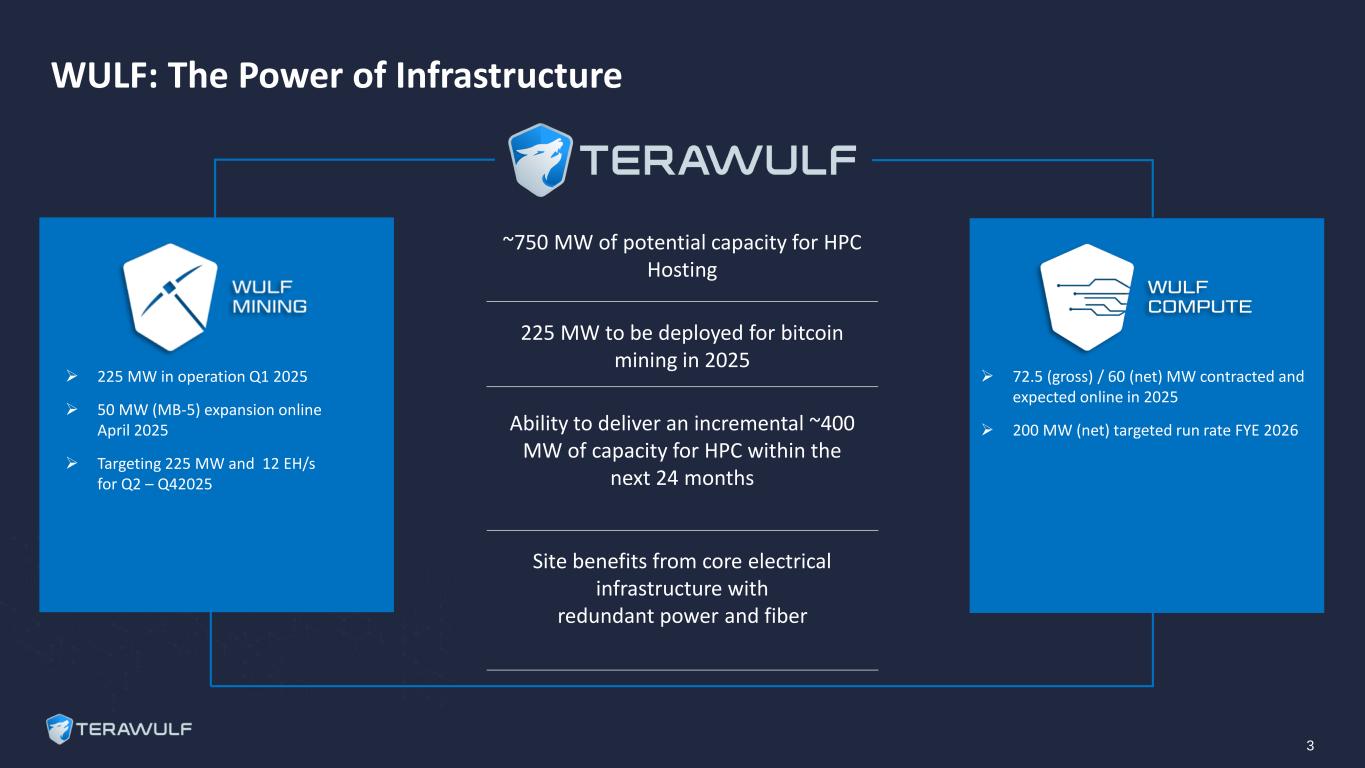
WULF: The Power of Infrastructure ~750 MW of potential capacity for HPC Hosting 225 MW to be deployed for bitcoin mining in 2025 Ability to deliver an incremental ~400 MW of capacity for HPC within the next 24 months Site benefits from core electrical infrastructure with redundant power and fiber ➢ 225 MW in operation Q1 2025 ➢ 50 MW (MB-5) expansion online April 2025 ➢ Targeting 225 MW and 12 EH/s for Q2 – Q42025 ➢ 72.5 (gross) / 60 (net) MW contracted and expected online in 2025 ➢ 200 MW (net) targeted run rate FYE 2026 3
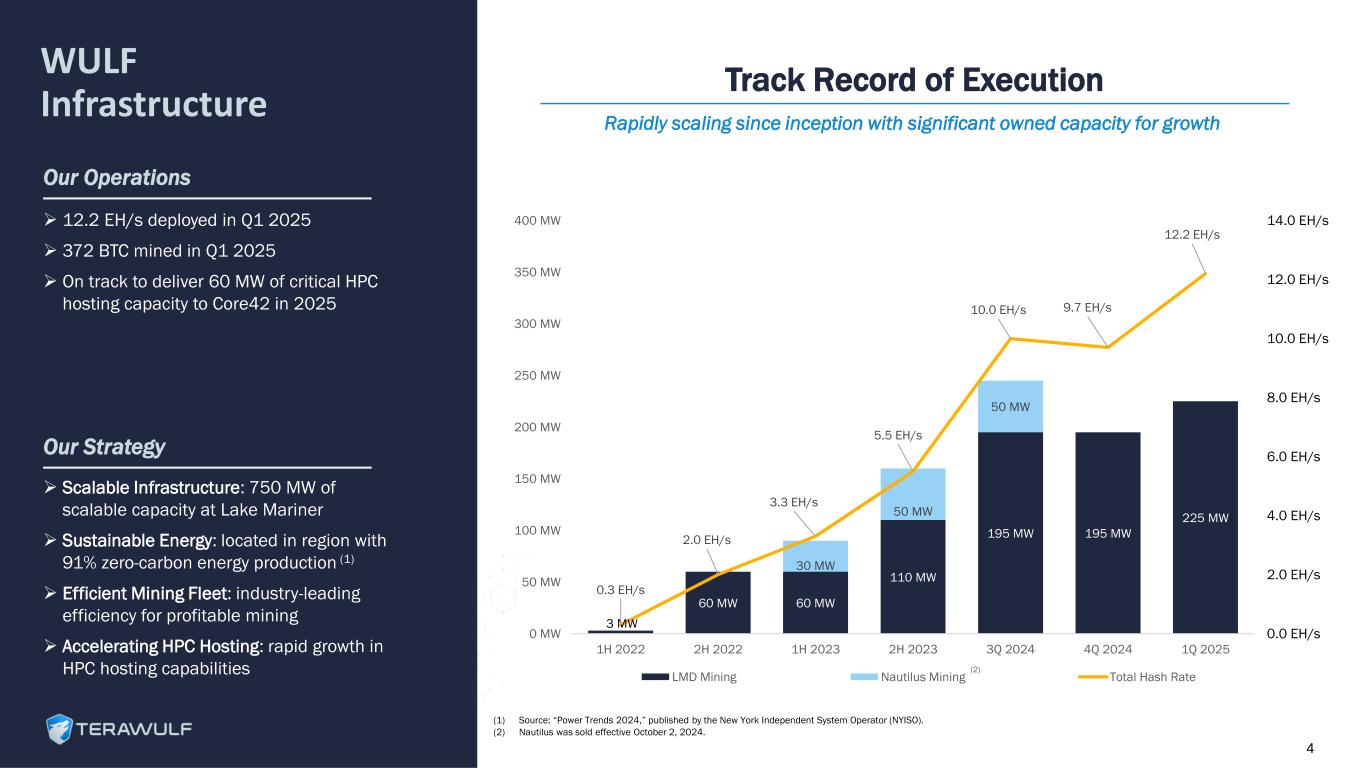
3 MW 60 MW 60 MW 110 MW 195 MW 195 MW 225 MW 30 MW 50 MW 50 MW 0.3 EH/s 2.0 EH/s 3.3 EH/s 5.5 EH/s 10.0 EH/s 9.7 EH/s 12.2 EH/s 0.0 EH/s 2.0 EH/s 4.0 EH/s 6.0 EH/s 8.0 EH/s 10.0 EH/s 12.0 EH/s 14.0 EH/s 0 MW 50 MW 100 MW 150 MW 200 MW 250 MW 300 MW 350 MW 400 MW 1H 2022 2H 2022 1H 2023 2H 2023 3Q 2024 4Q 2024 1Q 2025 LMD Mining Nautilus Mining Total Hash Rate WULF Infrastructure Our Operations ➢ Scalable Infrastructure: 750 MW of scalable capacity at Lake Mariner ➢ Sustainable Energy: located in region with 91% zero-carbon energy production (1) ➢ Efficient Mining Fleet: industry-leading efficiency for profitable mining ➢ Accelerating HPC Hosting: rapid growth in HPC hosting capabilities Our Strategy ➢ 12.2 EH/s deployed in Q1 2025 ➢ 372 BTC mined in Q1 2025 ➢ On track to deliver 60 MW of critical HPC hosting capacity to Core42 in 2025 Track Record of Execution Rapidly scaling since inception with significant owned capacity for growth 4 (2) (1) Source: “Power Trends 2024,” published by the New York Independent System Operator (NYISO). (2) Nautilus was sold effective October 2, 2024.
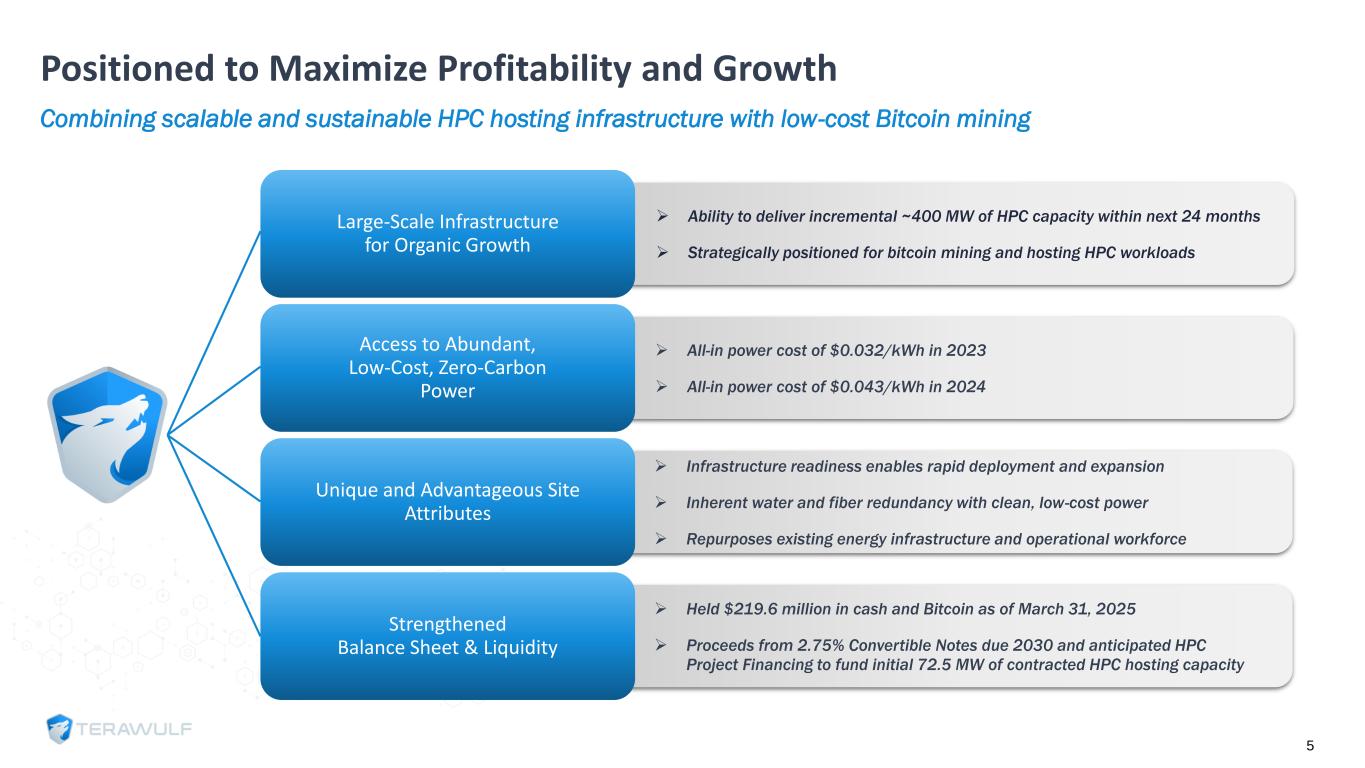
Positioned to Maximize Profitability and Growth Combining scalable and sustainable HPC hosting infrastructure with low-cost Bitcoin mining ➢ Ability to deliver incremental ~400 MW of HPC capacity within next 24 months ➢ Strategically positioned for bitcoin mining and hosting HPC workloads Large-Scale Infrastructure for Organic Growth ➢ All-in power cost of $0.032/kWh in 2023 ➢ All-in power cost of $0.043/kWh in 2024 Access to Abundant, Low-Cost, Zero-Carbon Power ➢ Infrastructure readiness enables rapid deployment and expansion ➢ Inherent water and fiber redundancy with clean, low-cost power ➢ Repurposes existing energy infrastructure and operational workforce Unique and Advantageous Site Attributes ➢ Held $219.6 million in cash and Bitcoin as of March 31, 2025 ➢ Proceeds from 2.75% Convertible Notes due 2030 and anticipated HPC Project Financing to fund initial 72.5 MW of contracted HPC hosting capacity Strengthened Balance Sheet & Liquidity 5
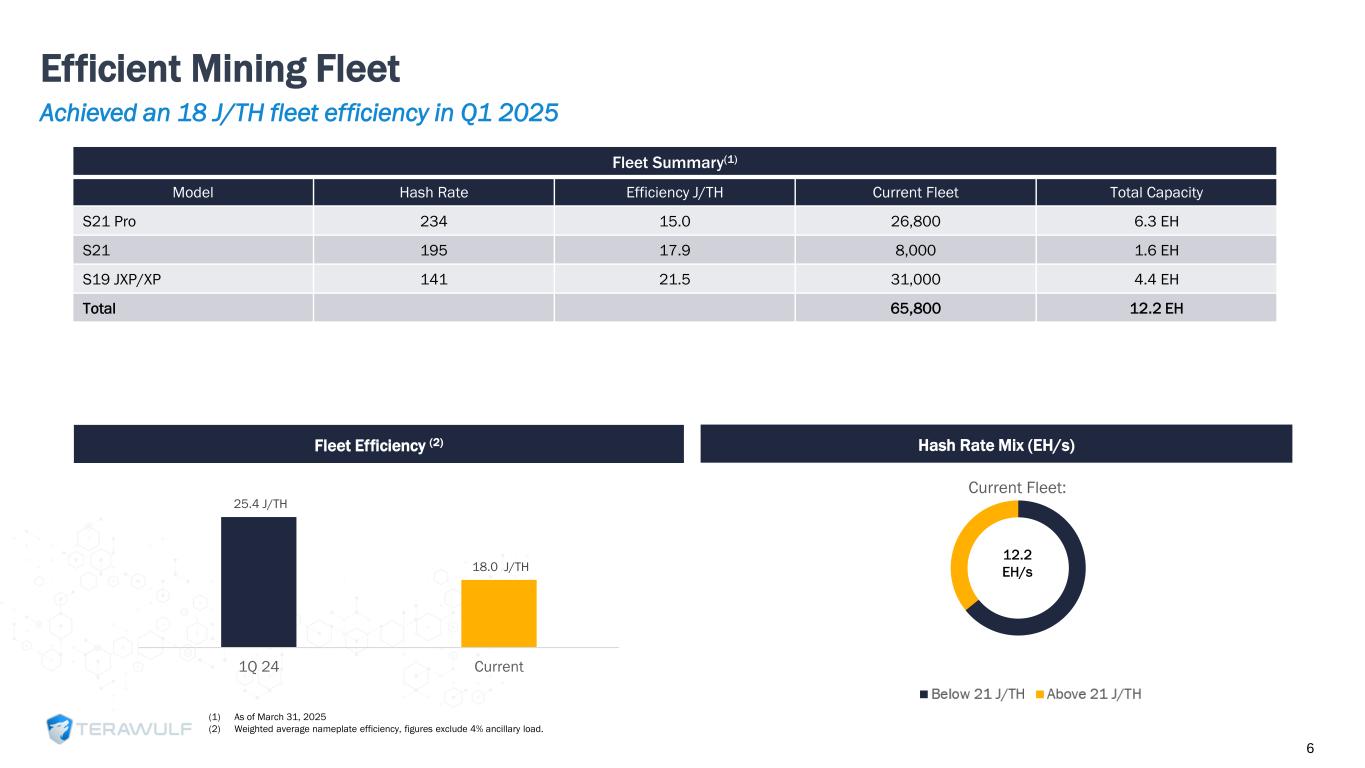
Efficient Mining Fleet (1) As of March 31, 2025 (2) Weighted average nameplate efficiency, figures exclude 4% ancillary load. Fleet Summary(1) Model Hash Rate Efficiency J/TH Current Fleet Total Capacity S21 Pro 234 15.0 26,800 6.3 EH S21 195 17.9 8,000 1.6 EH S19 JXP/XP 141 21.5 31,000 4.4 EH Total 65,800 12.2 EH Fleet Efficiency (2) Hash Rate Mix (EH/s) Current Fleet: 12.2 EH/s 6 Achieved an 18 J/TH fleet efficiency in Q1 2025 25.4 J/TH 18.0 J/TH 1Q 24 Current
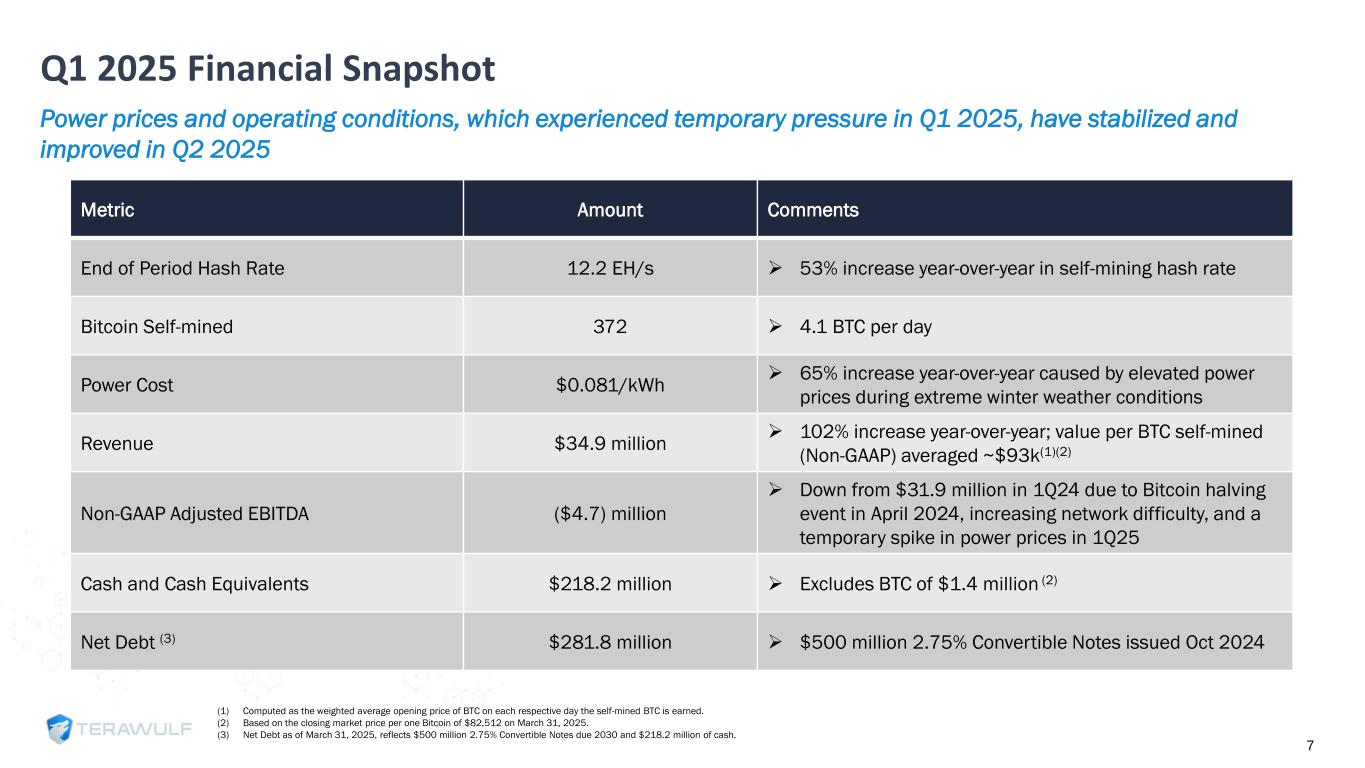
Q1 2025 Financial Snapshot Power prices and operating conditions, which experienced temporary pressure in Q1 2025, have stabilized and improved in Q2 2025 Metric Amount Comments End of Period Hash Rate 12.2 EH/s ➢ 53% increase year-over-year in self-mining hash rate Bitcoin Self-mined 372 ➢ 4.1 BTC per day Power Cost $0.081/kWh ➢ 65% increase year-over-year caused by elevated power prices during extreme winter weather conditions Revenue $34.9 million ➢ 102% increase year-over-year; value per BTC self-mined (Non-GAAP) averaged ~$93k(1)(2) Non-GAAP Adjusted EBITDA ($4.7) million ➢ Down from $31.9 million in 1Q24 due to Bitcoin halving event in April 2024, increasing network difficulty, and a temporary spike in power prices in 1Q25 Cash and Cash Equivalents $218.2 million ➢ Excludes BTC of $1.4 million (2) Net Debt (3) $281.8 million ➢ $500 million 2.75% Convertible Notes issued Oct 2024 (1) Computed as the weighted average opening price of BTC on each respective day the self-mined BTC is earned. (2) Based on the closing market price per one Bitcoin of $82,512 on March 31, 2025. (3) Net Debt as of March 31, 2025, reflects $500 million 2.75% Convertible Notes due 2030 and $218.2 million of cash. 7
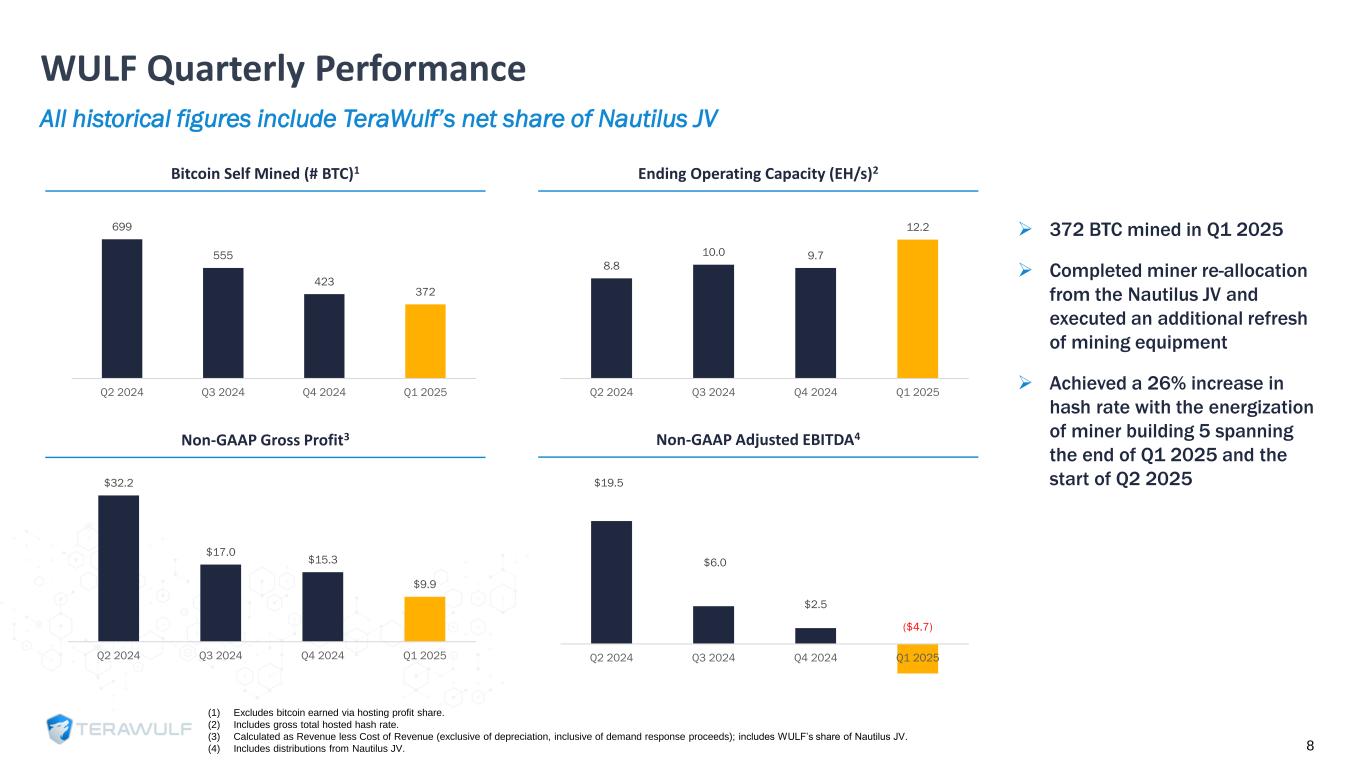
WULF Quarterly Performance All historical figures include TeraWulf’s net share of Nautilus JV 699 555 423 372 Q2 2024 Q3 2024 Q4 2024 Q1 2025 Bitcoin Self Mined (# BTC)1 8.8 10.0 9.7 12.2 Q2 2024 Q3 2024 Q4 2024 Q1 2025 Ending Operating Capacity (EH/s)2 $32.2 $17.0 $15.3 $9.9 Q2 2024 Q3 2024 Q4 2024 Q1 2025 Non-GAAP Gross Profit3 $19.5 $6.0 $2.5 ($4.7) Q2 2024 Q3 2024 Q4 2024 Q1 2025 Non-GAAP Adjusted EBITDA4 (1) Excludes bitcoin earned via hosting profit share. (2) Includes gross total hosted hash rate. (3) Calculated as Revenue less Cost of Revenue (exclusive of depreciation, inclusive of demand response proceeds); includes WULF’s share of Nautilus JV. (4) Includes distributions from Nautilus JV. ➢ 372 BTC mined in Q1 2025 ➢ Completed miner re-allocation from the Nautilus JV and executed an additional refresh of mining equipment ➢ Achieved a 26% increase in hash rate with the energization of miner building 5 spanning the end of Q1 2025 and the start of Q2 2025 8

Q1 2025 Capital Allocation Execution of bitcoin mining growth and HPC hosting infrastructure buildout (1) Reflects capex spend for first 72.5 MW of contracted HPC hosting capacity. (2) Includes electrical capital expenditures required to expand the Lake Mariner facility to 500 MW. $274 ($20) $90 ($76) ($33) ($10) ($7) Cash on Balance Sheet 4Q24 1Q25A Free Cash Flow Core42 Pre-Pay HPC Hosting Capacity (1) Share Repurchases Miner Buildings & ASICS Site Electrical (2) B/S Cash at 3/31/25 $0.0 $50.0 $100.0 $150.0 $200.0 $250.0 $300.0 $350.0 $400.0 $218 9
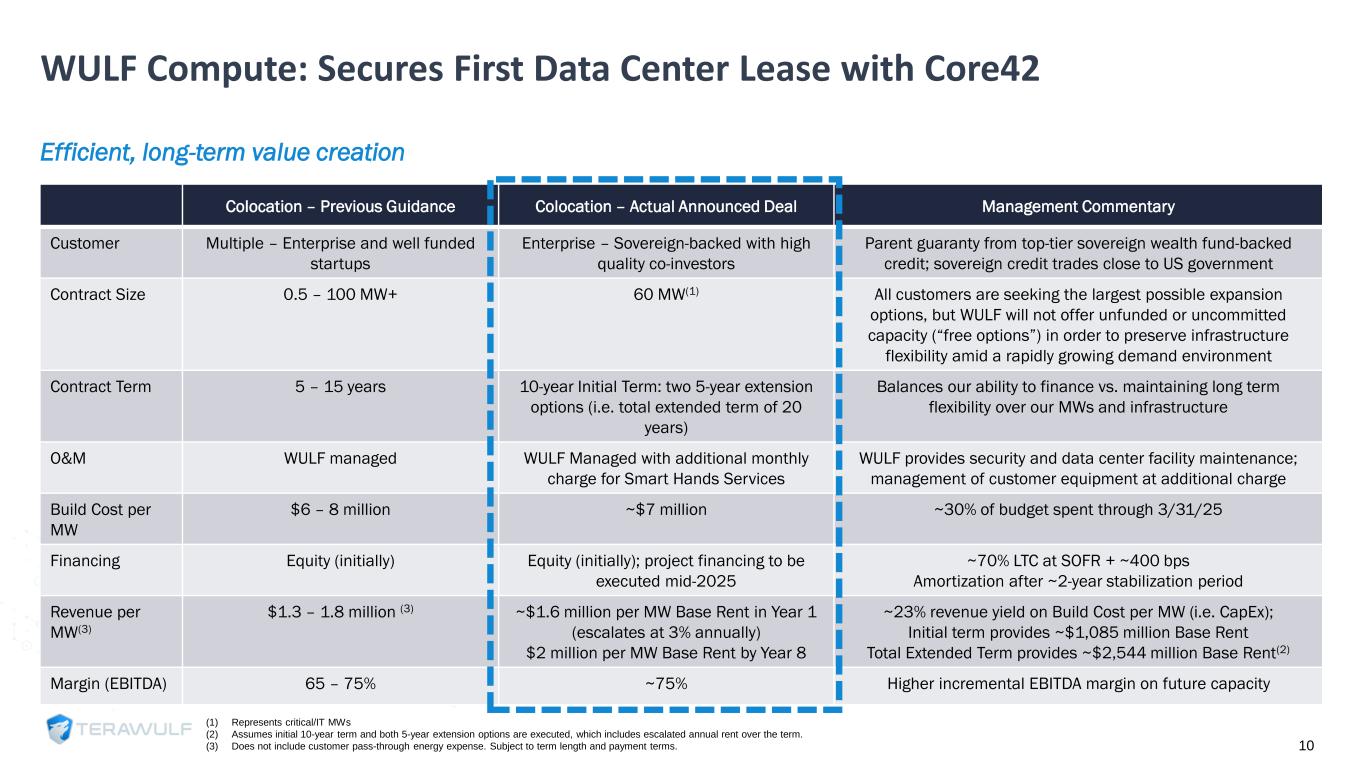
WULF Compute: Secures First Data Center Lease with Core42 Efficient, long-term value creation Colocation – Previous Guidance Colocation – Actual Announced Deal Management Commentary Customer Multiple – Enterprise and well funded startups Enterprise – Sovereign-backed with high quality co-investors Parent guaranty from top-tier sovereign wealth fund-backed credit; sovereign credit trades close to US government Contract Size 0.5 – 100 MW+ 60 MW(1) All customers are seeking the largest possible expansion options, but WULF will not offer unfunded or uncommitted capacity (“free options”) in order to preserve infrastructure flexibility amid a rapidly growing demand environment Contract Term 5 – 15 years 10-year Initial Term: two 5-year extension options (i.e. total extended term of 20 years) Balances our ability to finance vs. maintaining long term flexibility over our MWs and infrastructure O&M WULF managed WULF Managed with additional monthly charge for Smart Hands Services WULF provides security and data center facility maintenance; management of customer equipment at additional charge Build Cost per MW $6 – 8 million ~$7 million ~30% of budget spent through 3/31/25 Financing Equity (initially) Equity (initially); project financing to be executed mid-2025 ~70% LTC at SOFR + ~400 bps Amortization after ~2-year stabilization period Revenue per MW(3) $1.3 – 1.8 million (3) ~$1.6 million per MW Base Rent in Year 1 (escalates at 3% annually) $2 million per MW Base Rent by Year 8 ~23% revenue yield on Build Cost per MW (i.e. CapEx); Initial term provides ~$1,085 million Base Rent Total Extended Term provides ~$2,544 million Base Rent(2) Margin (EBITDA) 65 – 75% ~75% Higher incremental EBITDA margin on future capacity (1) Represents critical/IT MWs (2) Assumes initial 10-year term and both 5-year extension options are executed, which includes escalated annual rent over the term. (3) Does not include customer pass-through energy expense. Subject to term length and payment terms. 10
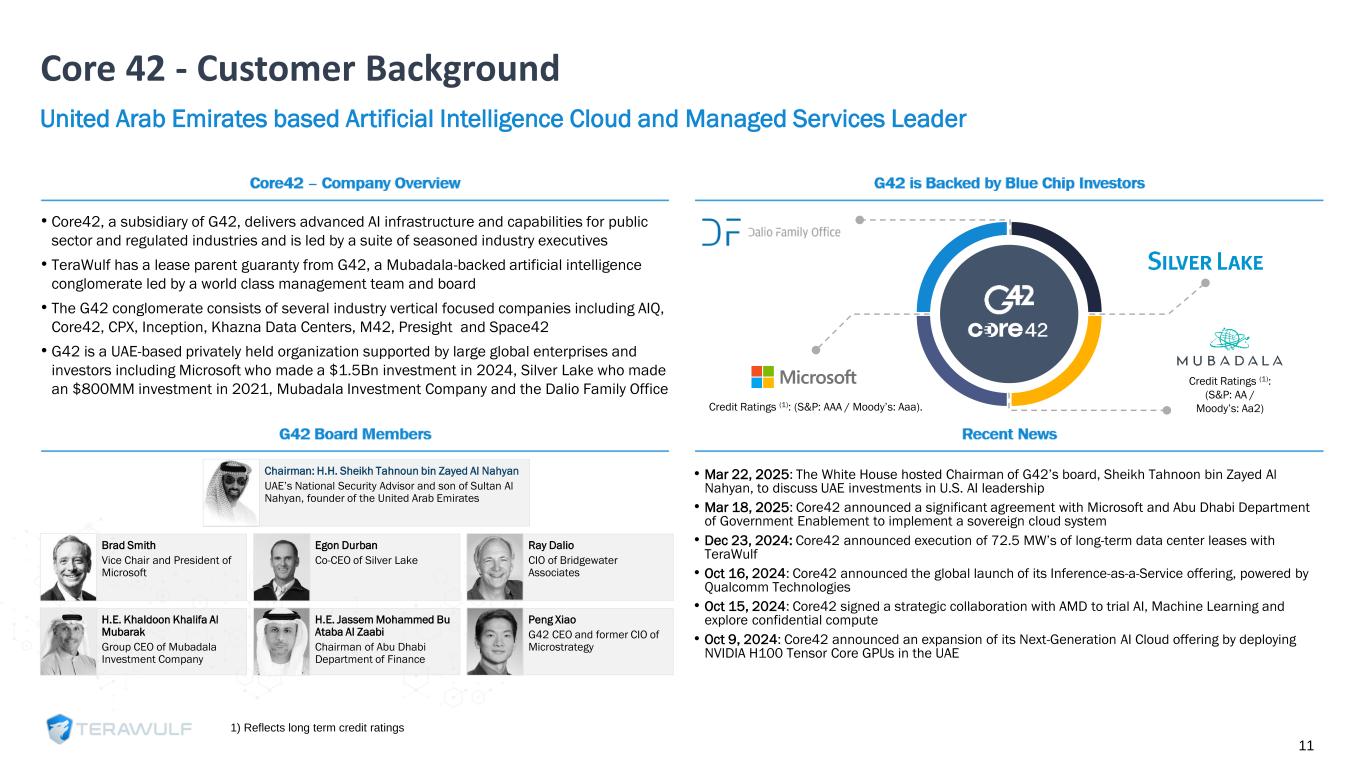
Core 42 - Customer Background United Arab Emirates based Artificial Intelligence Cloud and Managed Services Leader 1) Reflects long term credit ratings 11 • Core42, a subsidiary of G42, delivers advanced AI infrastructure and capabilities for public sector and regulated industries and is led by a suite of seasoned industry executives • TeraWulf has a lease parent guaranty from G42, a Mubadala-backed artificial intelligence conglomerate led by a world class management team and board • The G42 conglomerate consists of several industry vertical focused companies including AIQ, Core42, CPX, Inception, Khazna Data Centers, M42, Presight and Space42 • G42 is a UAE-based privately held organization supported by large global enterprises and investors including Microsoft who made a $1.5Bn investment in 2024, Silver Lake who made an $800MM investment in 2021, Mubadala Investment Company and the Dalio Family Office Chairman: H.H. Sheikh Tahnoun bin Zayed Al Nahyan UAE’s National Security Advisor and son of Sultan Al Nahyan, founder of the United Arab Emirates Brad Smith Vice Chair and President of Microsoft Egon Durban Co-CEO of Silver Lake Ray Dalio CIO of Bridgewater Associates H.E. Khaldoon Khalifa Al Mubarak Group CEO of Mubadala Investment Company H.E. Jassem Mohammed Bu Ataba Al Zaabi Chairman of Abu Dhabi Department of Finance Peng Xiao G42 CEO and former CIO of Microstrategy • Mar 22, 2025: The White House hosted Chairman of G42’s board, Sheikh Tahnoon bin Zayed Al Nahyan, to discuss UAE investments in U.S. AI leadership • Mar 18, 2025: Core42 announced a significant agreement with Microsoft and Abu Dhabi Department of Government Enablement to implement a sovereign cloud system • Dec 23, 2024: Core42 announced execution of 72.5 MW’s of long-term data center leases with TeraWulf • Oct 16, 2024: Core42 announced the global launch of its Inference-as-a-Service offering, powered by Qualcomm Technologies • Oct 15, 2024: Core42 signed a strategic collaboration with AMD to trial AI, Machine Learning and explore confidential compute • Oct 9, 2024: Core42 announced an expansion of its Next-Generation AI Cloud offering by deploying NVIDIA H100 Tensor Core GPUs in the UAE Credit Ratings (1): (S&P: AAA / Moody’s: Aaa). Credit Ratings (1): (S&P: AA / Moody’s: Aa2)
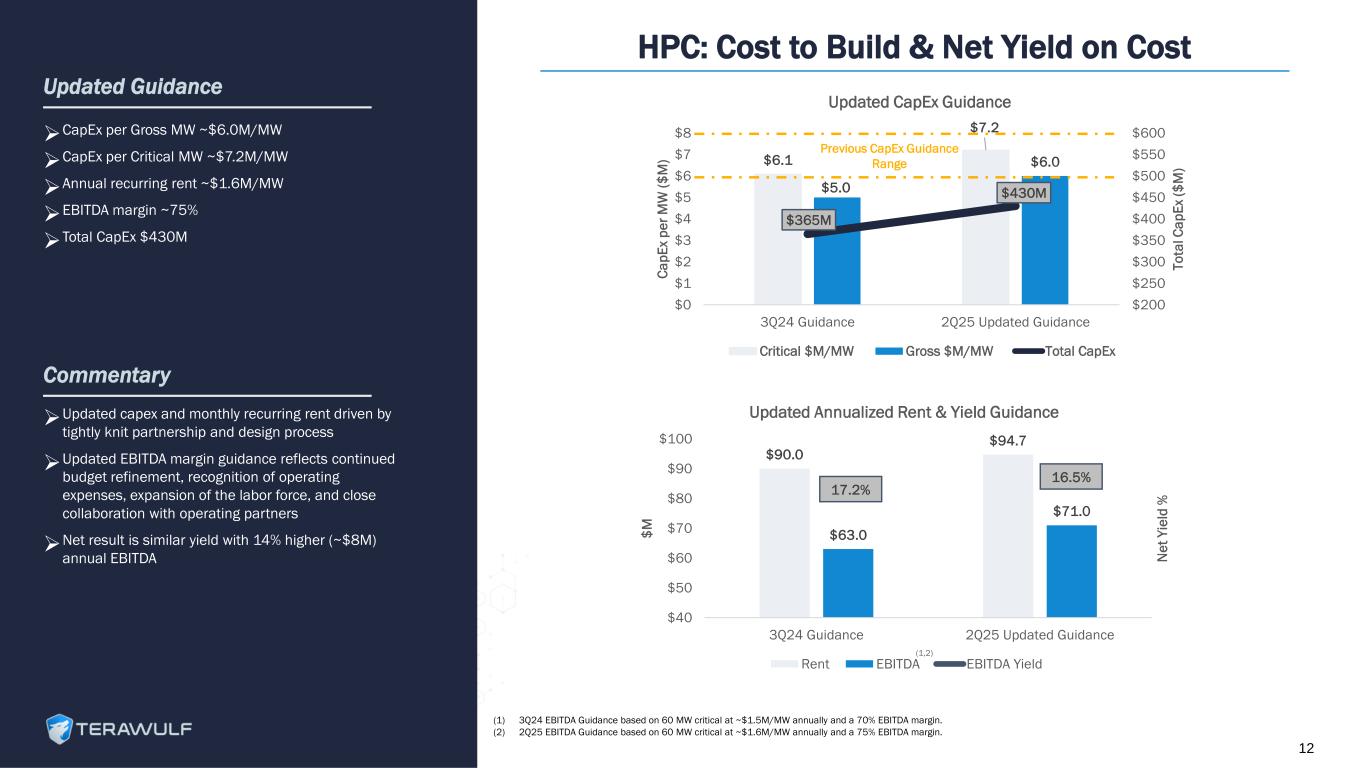
Updated Guidance ➢ Updated capex and monthly recurring rent driven by tightly knit partnership and design process ➢ Updated EBITDA margin guidance reflects continued budget refinement, recognition of operating expenses, expansion of the labor force, and close collaboration with operating partners ➢ Net result is similar yield with 14% higher (~$8M) annual EBITDA Commentary ➢ CapEx per Gross MW ~$6.0M/MW ➢ CapEx per Critical MW ~$7.2M/MW ➢ Annual recurring rent ~$1.6M/MW ➢ EBITDA margin ~75% ➢ Total CapEx $430M HPC: Cost to Build & Net Yield on Cost 12 (1) 3Q24 EBITDA Guidance based on 60 MW critical at ~$1.5M/MW annually and a 70% EBITDA margin. (2) 2Q25 EBITDA Guidance based on 60 MW critical at ~$1.6M/MW annually and a 75% EBITDA margin. $6.1 $7.2 $5.0 $6.0 $365M $430M $200 $250 $300 $350 $400 $450 $500 $550 $600 $0 $1 $2 $3 $4 $5 $6 $7 $8 3Q24 Guidance 2Q25 Updated Guidance T o ta l C a p E x ($ M ) C a p E x p e r M W ( $ M ) Updated CapEx Guidance Critical $M/MW Gross $M/MW Total CapEx $90.0 $94.7 $63.0 $71.0 $40 $50 $60 $70 $80 $90 $100 3Q24 Guidance 2Q25 Updated Guidance N e t Y ie ld % $ M Updated Annualized Rent & Yield Guidance Rent EBITDA EBITDA Yield (1,2) 16.5% 17.2% Previous CapEx Guidance Range
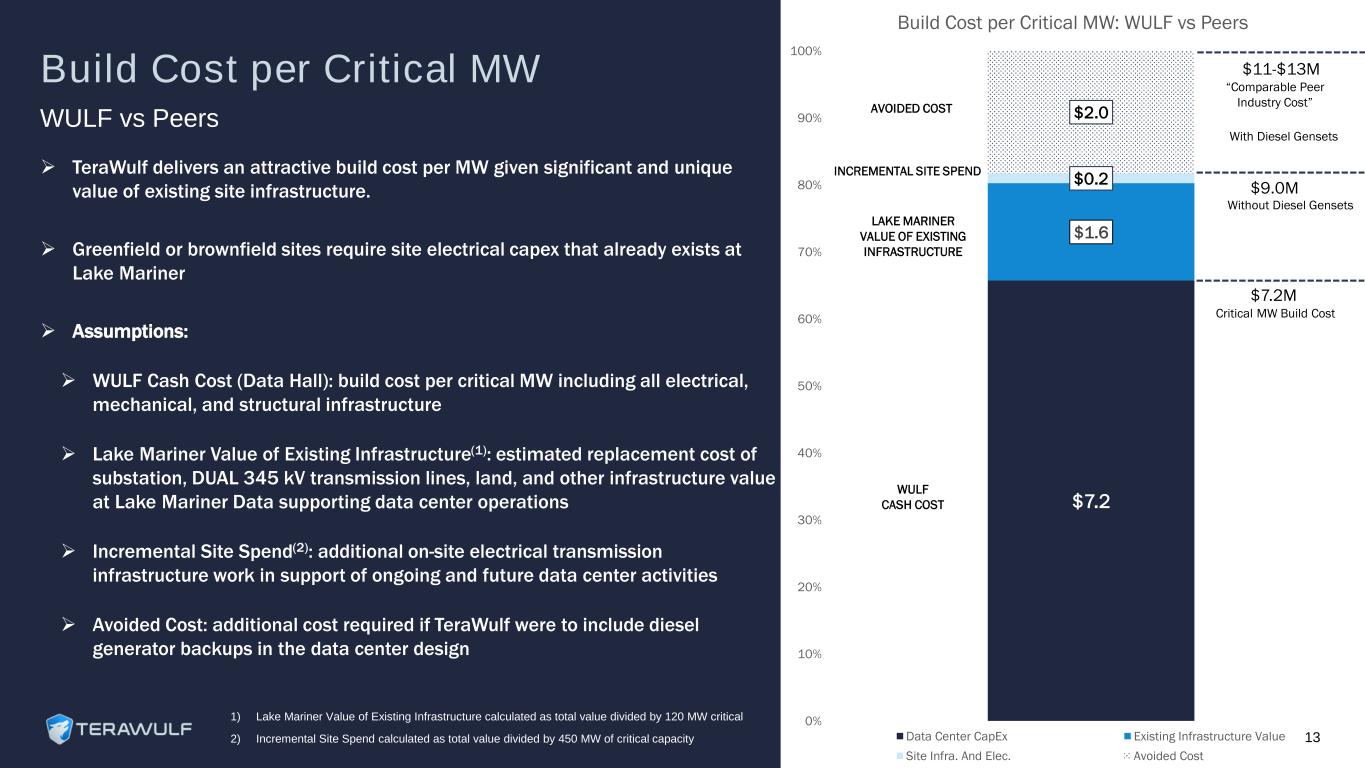
Build Cost per Critical MW ➢ TeraWulf delivers an attractive build cost per MW given significant and unique value of existing site infrastructure. ➢ Greenfield or brownfield sites require site electrical capex that already exists at Lake Mariner ➢ Assumptions: ➢ WULF Cash Cost (Data Hall): build cost per critical MW including all electrical, mechanical, and structural infrastructure ➢ Lake Mariner Value of Existing Infrastructure(1): estimated replacement cost of substation, DUAL 345 kV transmission lines, land, and other infrastructure value at Lake Mariner Data supporting data center operations ➢ Incremental Site Spend(2): additional on-site electrical transmission infrastructure work in support of ongoing and future data center activities ➢ Avoided Cost: additional cost required if TeraWulf were to include diesel generator backups in the data center design 1) Lake Mariner Value of Existing Infrastructure calculated as total value divided by 120 MW critical 2) Incremental Site Spend calculated as total value divided by 450 MW of critical capacity WULF vs Peers $7.2 $1.6 $0.2 $2.0 0% 10% 20% 30% 40% 50% 60% 70% 80% 90% 100% Build Cost per Critical MW: WULF vs Peers Data Center CapEx Existing Infrastructure Value Site Infra. And Elec. Avoided Cost $9.0M $11-$13M Without Diesel Gensets “Comparable Peer Industry Cost” $7.2M Critical MW Build Cost LAKE MARINER VALUE OF EXISTING INFRASTRUCTURE AVOIDED COST WULF CASH COST INCREMENTAL SITE SPEND 13 With Diesel Gensets

2025 Capital Allocation Core42 contract unlocks substantial platform value (1) Estimated Project Financing assumes that ~70% of total project costs for Wulf Den, CB-1 and CB-2 are financed. (2) Reflects capex spend for first 72.5 MW of contracted HPC hosting capacity. $218 $0 $300 ($300) ($60) Cash on BS 3/31/25 2Q25 - 4Q25E Free Cash Flow Project Financing (1) HPC Hosting Capacity (2) Site Electrical & Infra Estimated Unallocated Cash $0.0 $100.0 $200.0 $300.0 $400.0 $500.0 $600.0 Substantial unallocated cash balance $158 14
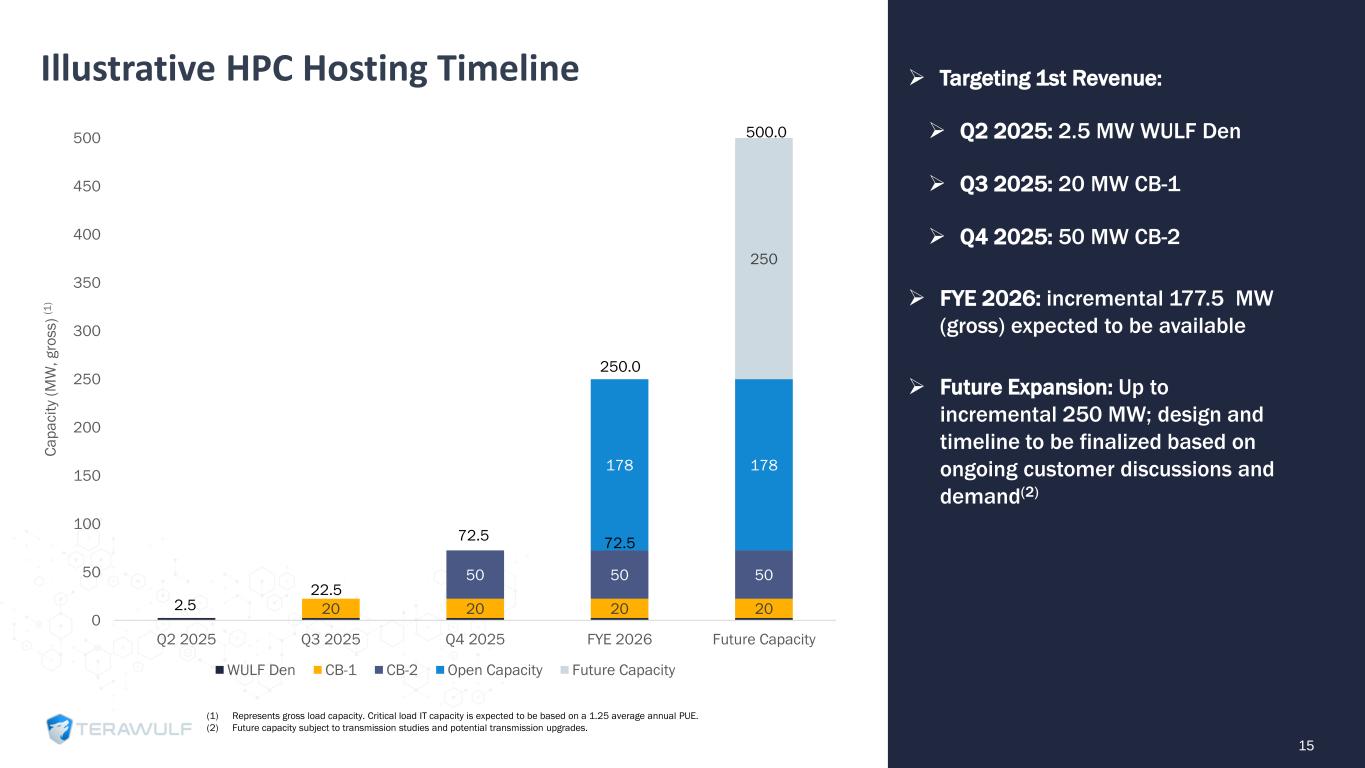
Illustrative HPC Hosting Timeline 15 ➢ Targeting 1st Revenue: ➢ Q2 2025: 2.5 MW WULF Den ➢ Q3 2025: 20 MW CB-1 ➢ Q4 2025: 50 MW CB-2 ➢ FYE 2026: incremental 177.5 MW (gross) expected to be available ➢ Future Expansion: Up to incremental 250 MW; design and timeline to be finalized based on ongoing customer discussions and demand(2) (1) Represents gross load capacity. Critical load IT capacity is expected to be based on a 1.25 average annual PUE. (2) Future capacity subject to transmission studies and potential transmission upgrades. 20 20 20 20 50 50 50 178 178 250 0 50 100 150 200 250 300 350 400 450 500 Q2 2025 Q3 2025 Q4 2025 FYE 2026 Future Capacity C a p a c it y (M W , g ro s s ) (1 ) WULF Den CB-1 CB-2 Open Capacity Future Capacity 2.5 22.5 72.5 72.5 250.0 500.0
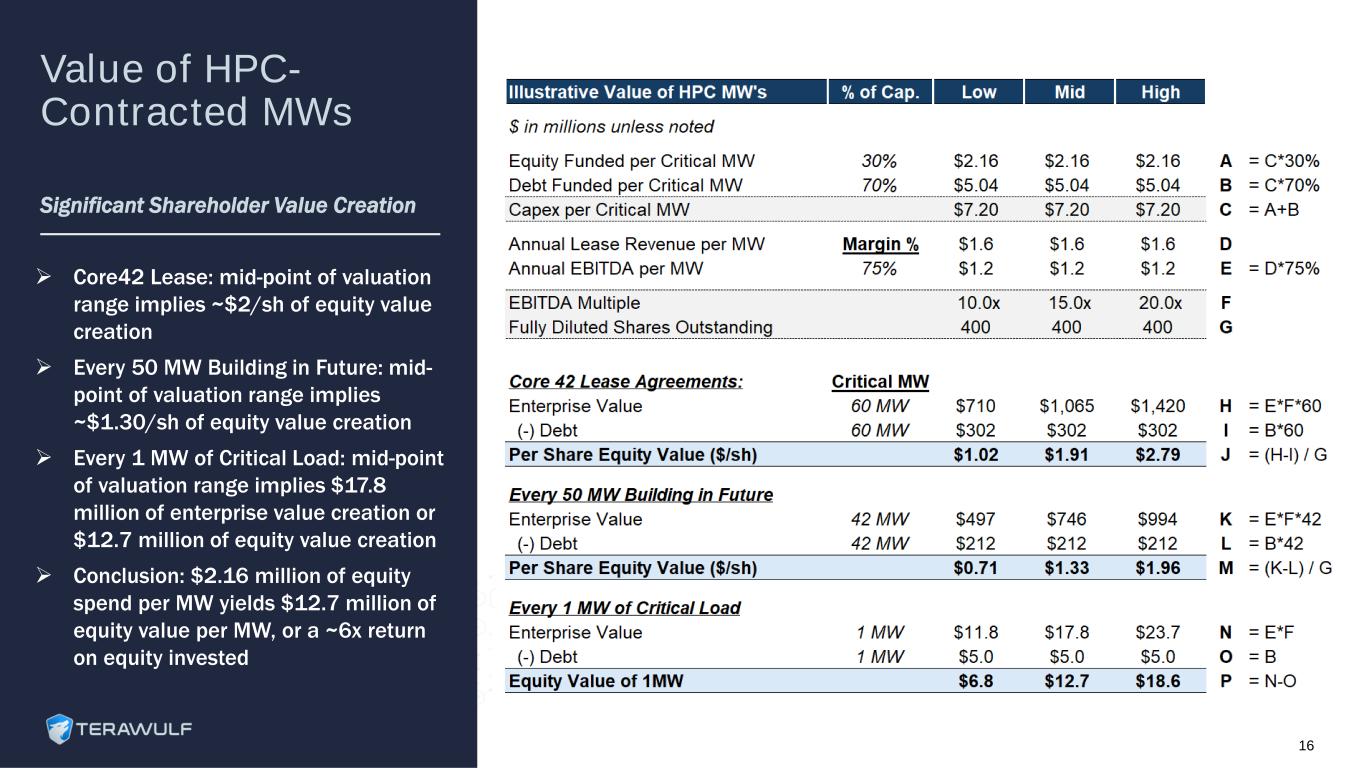
Value of HPC- Contracted MWs Significant Shareholder Value Creation ➢ Core42 Lease: mid-point of valuation range implies ~$2/sh of equity value creation ➢ Every 50 MW Building in Future: mid- point of valuation range implies ~$1.30/sh of equity value creation ➢ Every 1 MW of Critical Load: mid-point of valuation range implies $17.8 million of enterprise value creation or $12.7 million of equity value creation ➢ Conclusion: $2.16 million of equity spend per MW yields $12.7 million of equity value per MW, or a ~6x return on equity invested 16
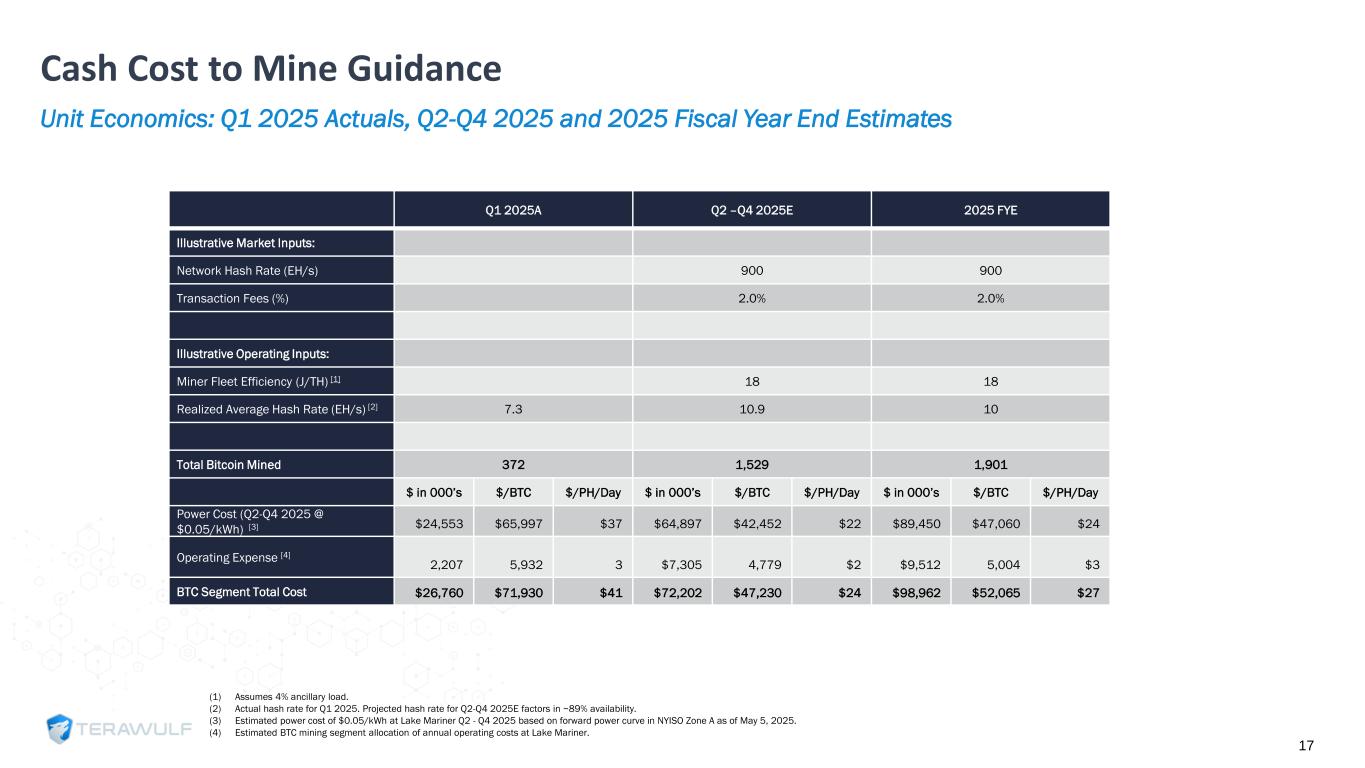
Unit Economics: Q1 2025 Actuals, Q2-Q4 2025 and 2025 Fiscal Year End Estimates Cash Cost to Mine Guidance (1) Assumes 4% ancillary load. (2) Actual hash rate for Q1 2025. Projected hash rate for Q2-Q4 2025E factors in ~89% availability. (3) Estimated power cost of $0.05/kWh at Lake Mariner Q2 - Q4 2025 based on forward power curve in NYISO Zone A as of May 5, 2025. (4) Estimated BTC mining segment allocation of annual operating costs at Lake Mariner. Q1 2025A Q2 –Q4 2025E 2025 FYE Illustrative Market Inputs: Network Hash Rate (EH/s) 900 900 Transaction Fees (%) 2.0% 2.0% Illustrative Operating Inputs: Miner Fleet Efficiency (J/TH) [1] 18 18 Realized Average Hash Rate (EH/s) [2] 7.3 10.9 10 Total Bitcoin Mined 372 1,529 1,901 $ in 000’s $/BTC $/PH/Day $ in 000’s $/BTC $/PH/Day $ in 000’s $/BTC $/PH/Day Power Cost (Q2-Q4 2025 @ $0.05/kWh) [3] $24,553 $65,997 $37 $64,897 $42,452 $22 $89,450 $47,060 $24 Operating Expense [4] 2,207 5,932 3 $7,305 4,779 $2 $9,512 5,004 $3 BTC Segment Total Cost $26,760 $71,930 $41 $72,202 $47,230 $24 $98,962 $52,065 $27 17
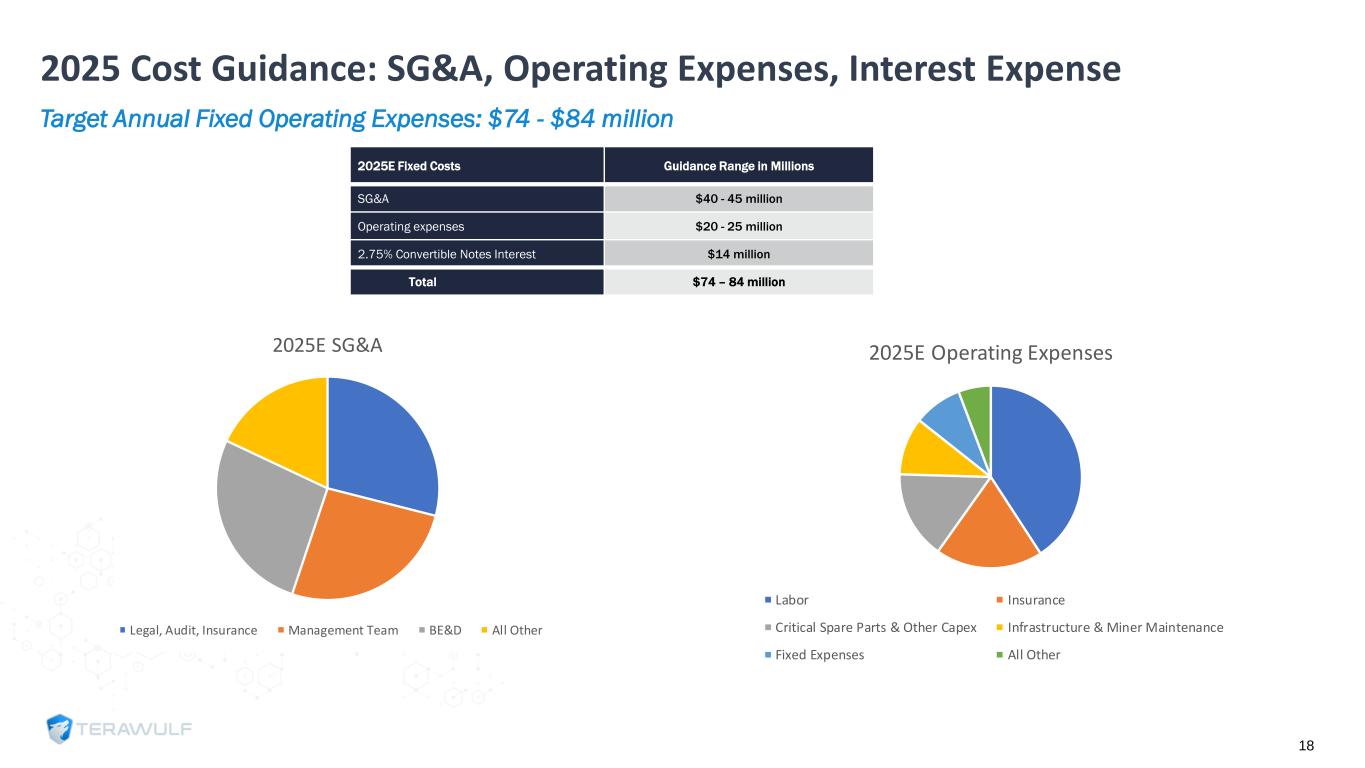
Target Annual Fixed Operating Expenses: $74 - $84 million 2025 Cost Guidance: SG&A, Operating Expenses, Interest Expense 2025E Operating Expenses Labor Insurance Critical Spare Parts & Other Capex Infrastructure & Miner Maintenance Fixed Expenses All Other 2025E SG&A Legal, Audit, Insurance Management Team BE&D All Other 2025E Fixed Costs Guidance Range SG&A $40 - $45 million Operating Expenses 20 - 25 million 2.75% Convertible Notes Interest 14 - 14 million Total $74 - $84 million 18 2025E Fixed Costs Guidance Range in Millions SG&A $40 - 5 million Operating expenses $20 - 25 million 2.75% Convertible Notes Interest $14 million Total $74 – 84 million
APPENDIX 19
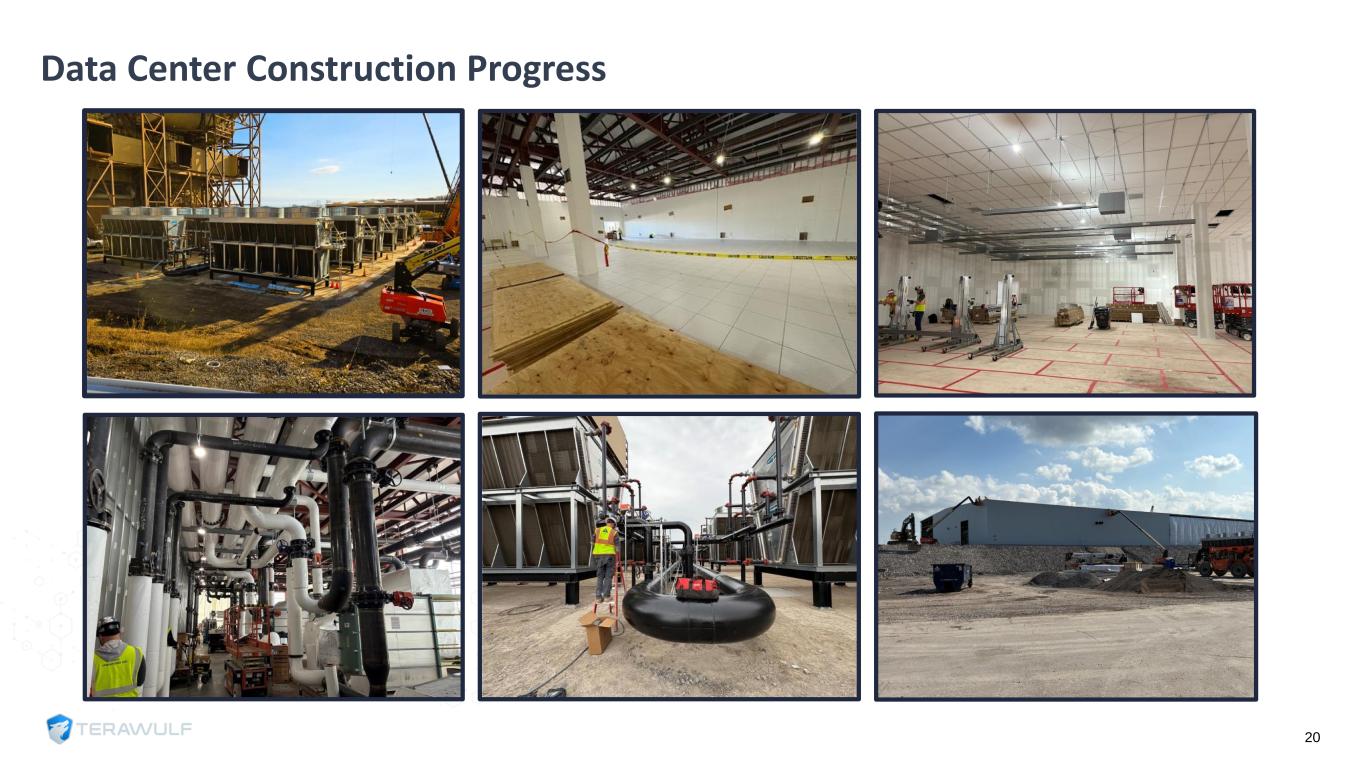
20 Data Center Construction Progress
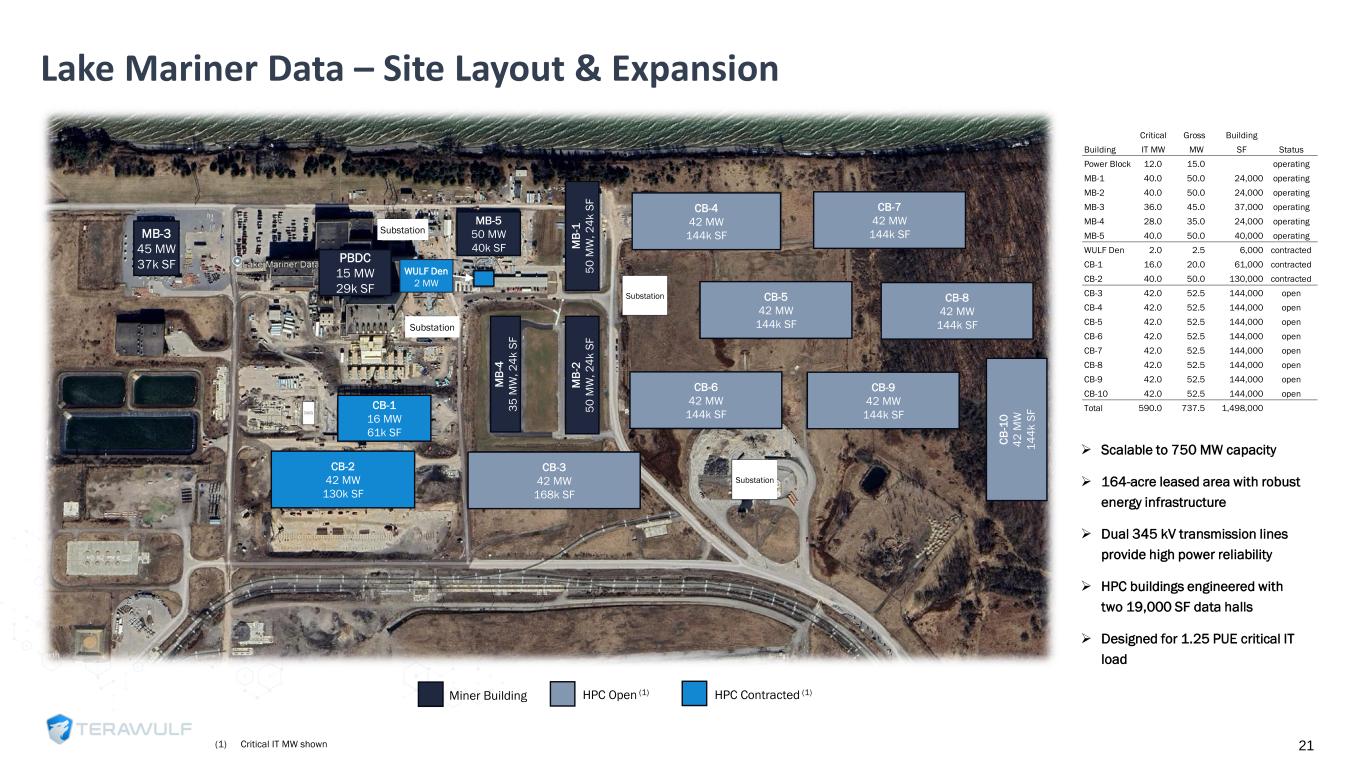
➢ Scalable to 750 MW capacity ➢ 164-acre leased area with robust energy infrastructure ➢ Dual 345 kV transmission lines provide high power reliability ➢ HPC buildings engineered with two 19,000 SF data halls ➢ Designed for 1.25 PUE critical IT load Critical Gross Building Building IT MW MW SF Status Power Block 12.0 15.0 operating MB-1 40.0 50.0 24,000 operating MB-2 40.0 50.0 24,000 operating MB-3 36.0 45.0 37,000 operating MB-4 28.0 35.0 24,000 operating MB-5 40.0 50.0 40,000 operating WULF Den 2.0 2.5 6,000 contracted CB-1 16.0 20.0 61,000 contracted CB-2 40.0 50.0 130,000 contracted CB-3 42.0 52.5 144,000 open CB-4 42.0 52.5 144,000 open CB-5 42.0 52.5 144,000 open CB-6 42.0 52.5 144,000 open CB-7 42.0 52.5 144,000 open CB-8 42.0 52.5 144,000 open CB-9 42.0 52.5 144,000 open CB-10 42.0 52.5 144,000 open Total 590.0 737.5 1,498,000 Miner Building HPC Open (1) HPC Contracted (1) Lake Ontario Lake Ontario MB-3 45 MW 37k SF M B -1 5 0 M W , 2 4 k S F M B -2 5 0 M W , 2 4 k S F M B -4 3 5 M W , 2 4 k S F MB-5 50 MW 40k SF CB-4 42 MW 144k SF CB-2 42 MW 130k SF CB-1 16 MW 61k SF WULF Den 2 MW Substation Substation Substation CB-7 42 MW 144k SF CB-5 42 MW 144k SF CB-8 42 MW 144k SF CB-6 42 MW 144k SF CB-9 42 MW 144k SF C B -1 0 4 2 M W 1 4 4 k S F CB-3 42 MW 168k SF Substation Lake Mariner Data – Site Layout & Expansion 21(1) Critical IT MW shown PBDC 15 MW 29k SF
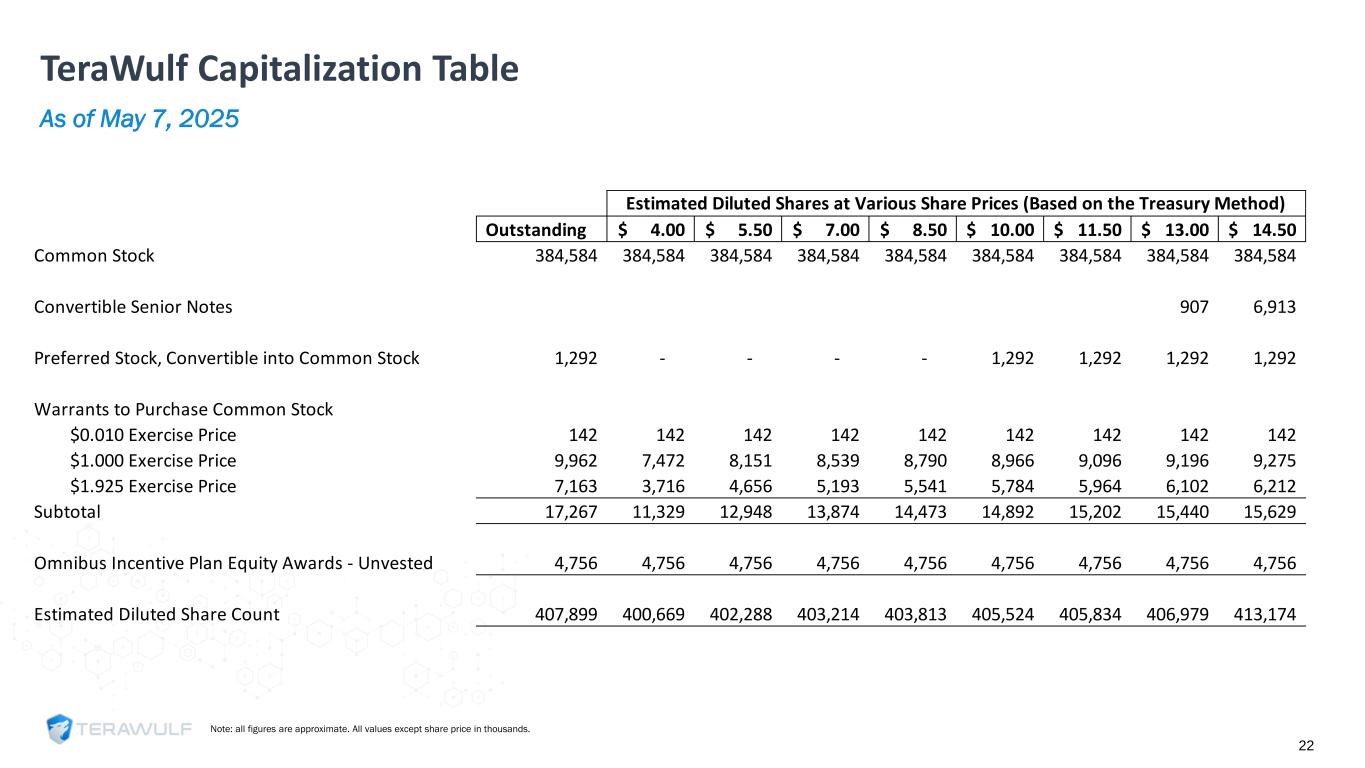
TeraWulf Capitalization Table As of May 7, 2025 Note: all figures are approximate. All values except share price in thousands. 22 Outstanding 4.00$ 5.50$ 7.00$ 8.50$ 10.00$ 11.50$ 13.00$ 14.50$ Common Stock 384,584 384,584 384,584 384,584 384,584 384,584 384,584 384,584 384,584 Convertible Senior Notes 907 6,913 Preferred Stock, Convertible into Common Stock 1,292 - - - - 1,292 1,292 1,292 1,292 Warrants to Purchase Common Stock $0.010 Exercise Price 142 142 142 142 142 142 142 142 142 $1.000 Exercise Price 9,962 7,472 8,151 8,539 8,790 8,966 9,096 9,196 9,275 $1.925 Exercise Price 7,163 3,716 4,656 5,193 5,541 5,784 5,964 6,102 6,212 Subtotal 17,267 11,329 12,948 13,874 14,473 14,892 15,202 15,440 15,629 Omnibus Incentive Plan Equity Awards - Unvested 4,756 4,756 4,756 4,756 4,756 4,756 4,756 4,756 4,756 Estimated Diluted Share Count 407,899 400,669 402,288 403,214 403,813 405,524 405,834 406,979 413,174 Estimated Diluted Shares at Various Share Prices (Based on the Treasury Method)
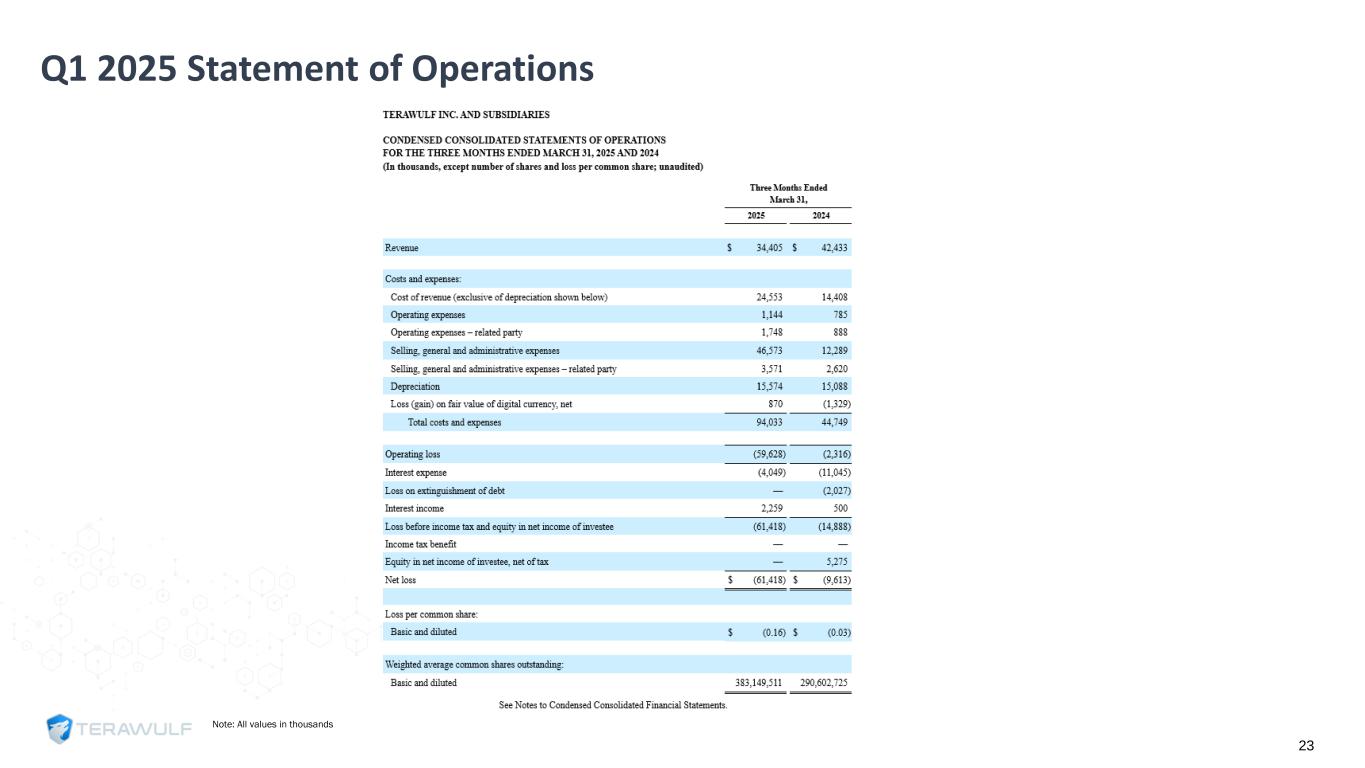
Q1 2025 Statement of Operations Note: All values in thousands 23
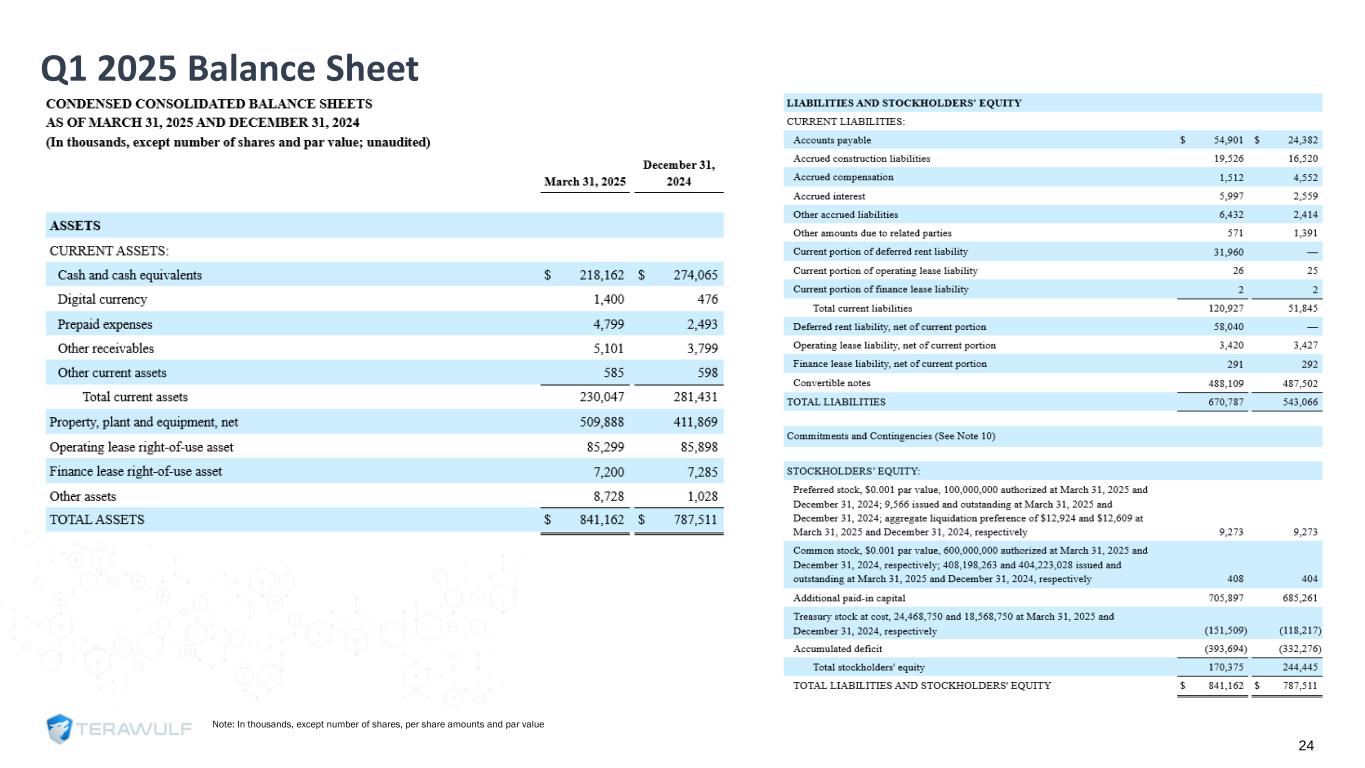
Q1 2025 Balance Sheet Note: In thousands, except number of shares, per share amounts and par value 24
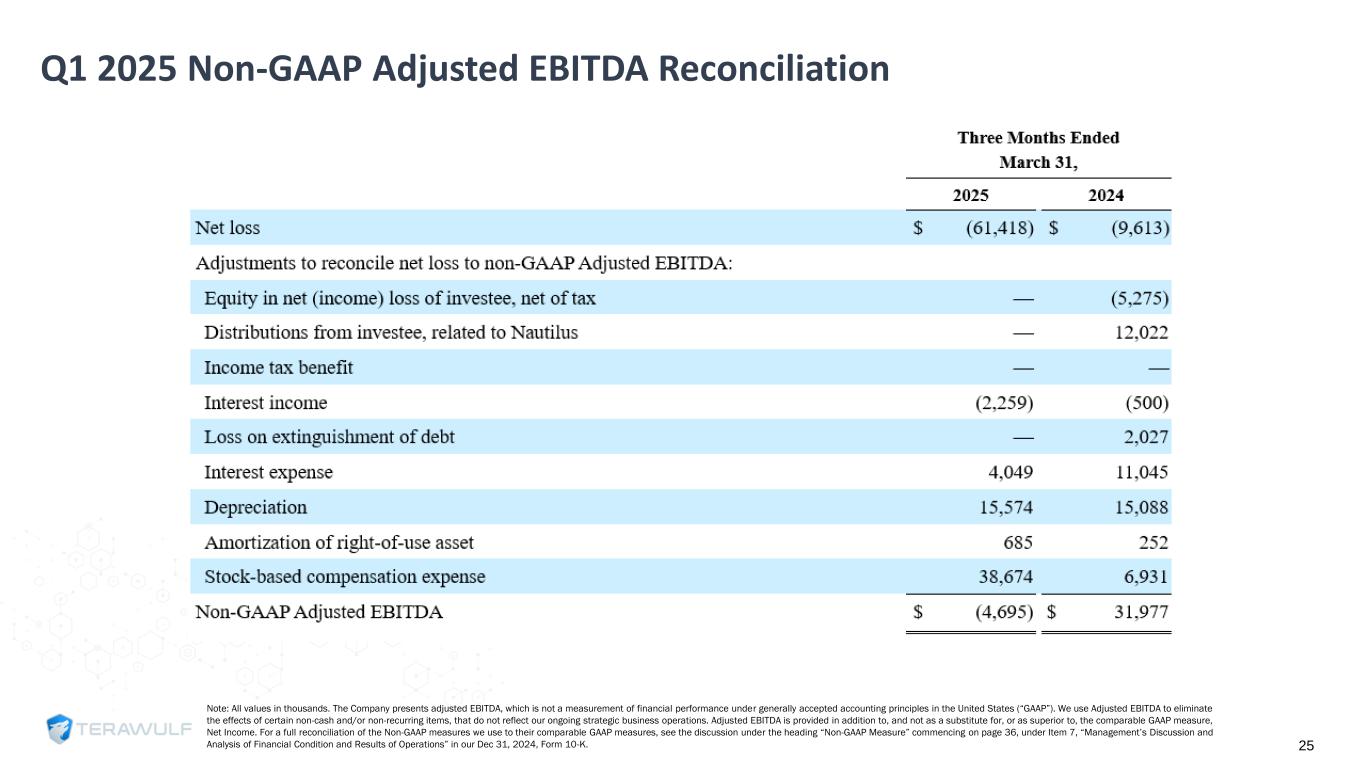
Q1 2025 Non-GAAP Adjusted EBITDA Reconciliation Note: All values in thousands. The Company presents adjusted EBITDA, which is not a measurement of financial performance under generally accepted accounting principles in the United States (“GAAP”). We use Adjusted EBITDA to eliminate the effects of certain non-cash and/or non-recurring items, that do not reflect our ongoing strategic business operations. Adjusted EBITDA is provided in addition to, and not as a substitute for, or as superior to, the comparable GAAP measure, Net Income. For a full reconciliation of the Non-GAAP measures we use to their comparable GAAP measures, see the discussion under the heading “Non-GAAP Measure” commencing on page 36, under Item 7, “Management’s Discussion and Analysis of Financial Condition and Results of Operations” in our Dec 31, 2024, Form 10-K. 25