EX-99.2
Published on
THE POWER OF INFRASTRUCTURE Q2 2026 BUSINESS UPDATE AUGUST 5, 2026 Q2
SAFE HARBOR STATEMENT SAFE HARBOR This presentation is for informational purposes only and contains forward - looking statements within the meaning of the “safe har bor” provisions of the Private Securities Litigation Reform Act of 1995, as amended. Such forward -looking statements include statements concerning anticipated future events and expectations that are not historical facts. All statements, other than statements of historical fact, are statements that could be deemed forward -looking statements. In addition, forward -looking statements are typically identified by words such as “plan,” “believe,” “goal,” “target,” “aim,” “expect,” “anticipate,” “intend,” “outlook,” “estimate,” “forecast,” “project,” “seek,” “continue,” “could,” “may,” “might,” “possible,” “potential,” “strategy,” “opportunity,” “predict,” “should,” “would” and other similar words and expressions, although the absence of these words or expressions does not mean t hat a statement is not forward -looking. Forward -looking statements are based on the current expectations and beliefs of TeraWulf’s management and are inherently subject to a number of factors, risks, uncertainties and assumptions and their potential effects. There can be no assurance that future developments will be those that have been anticipated. Actual results may vary material ly from those expressed or implied by forward -looking statements based on a number of factors, risks, uncertainties and assumptions, including, among others: (1) TeraWulf’s ability to attract additional customers to lease its HPC data centers; (2) TeraWulf’s ability to complete its data center campuses and future strategic growth initiatives in a timely manner or within anticipated cost es timates; (3) operational risks associated with its data centers and TeraWulf’s ability to perform under its existing data center lease agreements; (4) failure to obtain adequate financing on a timely basi s and/or on acceptable terms with regard to expansion or existing operations ; (5) changes in applicable laws, regulations and/or permits affecting TeraWulf’s operations or the industries in which it operates; (6) adverse geopolitical or economic conditions, including a high inflationary environment, the implementation of new tariffs and more restrictive trade regulations; (7) the pot ential of cybercrime, money -laundering, malware infections and phishing and/or loss and interference as a result of equipment malfunction or break -down, physical disaster, data security breac h, computer malfunction or sabotage (and the costs associated with any of the foregoing) ; (8) the availability and cost of power as well as electrical infrastructure equipment necessary to maintain and grow our busi ness and operations; and (9) other risks and uncertainties detailed from time to time in the Company’s filings with the Securities and Exchange Commission (“SEC”). Potent ial investors, stockholders and other readers are cautioned not to place undue reliance on these forward -looking statements, which speak only as of the date on which they were made. TeraWulf does not assume any obligation to publicly update any forward - looking statement after it was made, whether as a result of new information, future events or otherwise, except as required by law or regulation. Investors are referred to the full disc ussion of risks and uncertainties associated with forward - looking statements and the discussion of risk factors contained in the Company’s filin gs with the SEC, which are available at www.sec.gov. This presentation contains references to certain non -GAAP financial measures. For definitions of terms including, but not limite d to, “Adjusted EBITDA,” and a detailed reconciliation between the non-GAAP financial results presented in this presentation and the corresponding GAAP measures, please refer to the Appendix of t his presentation. 2
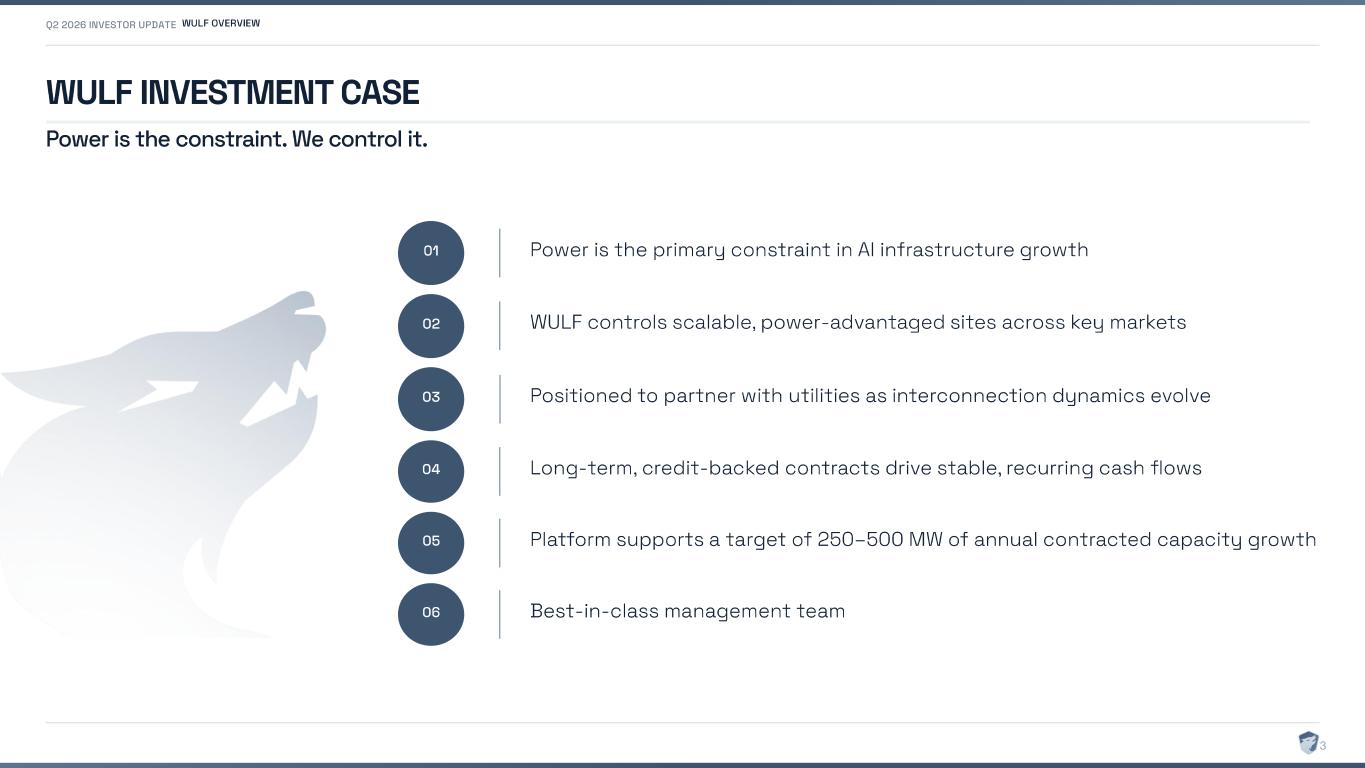
WULF INVESTMENT CASE Power is the primary constraint in AI infrastructure growth WULF controls scalable, power - advantaged sites across key markets Positioned to partner with utilities as interconnection dynamics evolve Long - term, credit - backed contracts drive stable, recurring cash flows Platform supports a target of 250 – 500 MW of annual contracted capacity growth 01 02 03 04 05 Power is the constraint. We control it. WULF OVERVIEW Best - in- class management team06 3
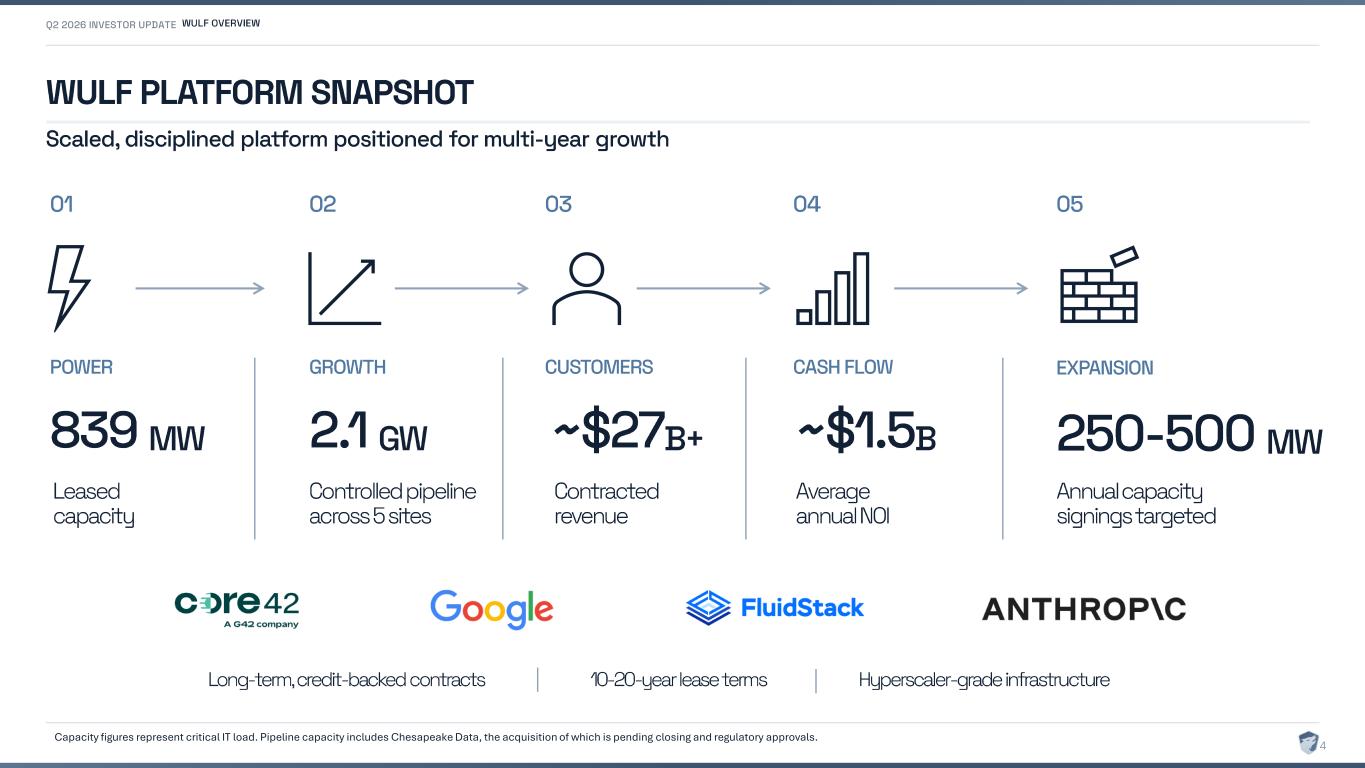
WULF PLATFORM SNAPSHOT Scaled, disciplined platform positioned for multi -year growth POWER 01 839 MW Leased capacity GROWTH 02 2.1 GW Controlled pipeline across 5 sites CUSTOMERS 03 ~$27 B+ Contracted revenue CASH FLOW 04 ~$1.5B Average annual NOI EXPANSION 05 250 -500 MW Annual capacity signings targeted Long-term, credit-backed contracts 10-20-year lease terms Hyperscaler-grade infrastructure Capacity figures represent critical IT load. Pipeline capacity includes Chesapeake Data, the acquisition of which is pending closing and regulatory approvals. WULF OVERVIEW 4
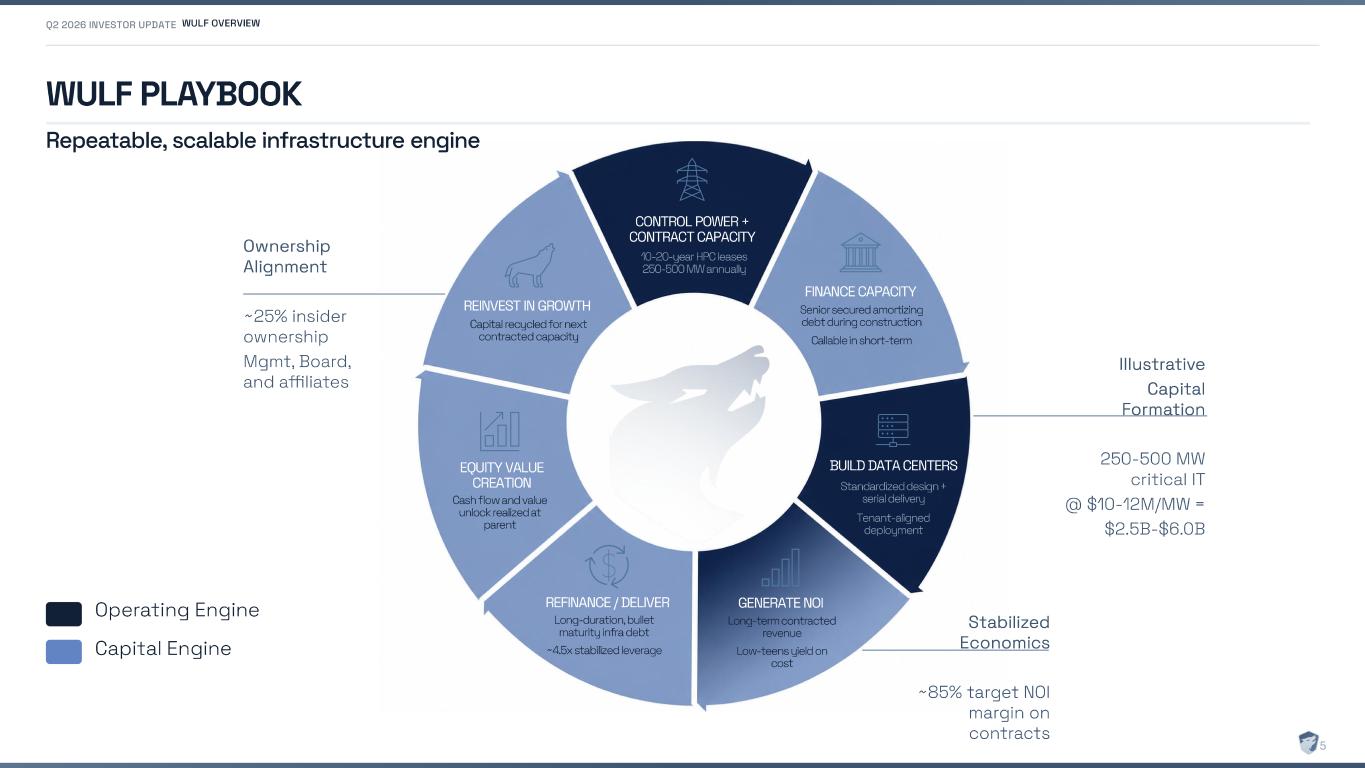
WULF PLAYBOOK Repeatable, scalable infrastructure engine CONTROL POWER + CONTRACT CAPACITY 10-20-year HPC leases 250-500 MW annually BUILD DATA CENTERS Standardized design + serial delivery Tenant -aligned deployment GENERATE NOI Long -term contracted revenue Low-teens yield on cost FINANCE CAPACITY Senior secured amortizing debt during construction Callable in short-term REFINANCE / DELIVER Long -duration, bullet maturity infra debt ~4.5x stabilized leverage REINVEST IN GROWTH Capital recycled for next contracted capacity EQUITY VALUE CREATION Cash flow and value unlock realized at parent Ownership Alignment ~25% insider ownership Mgmt , Board, and affiliates Operating Engine Capital Engine Illustrative Capital Formation 250 - 500 MW critical IT @ $10 - 12M/MW = $2.5B - $6.0B Stabilized Economics ~85% target NOI margin on contracts WULF OVERVIEW 5
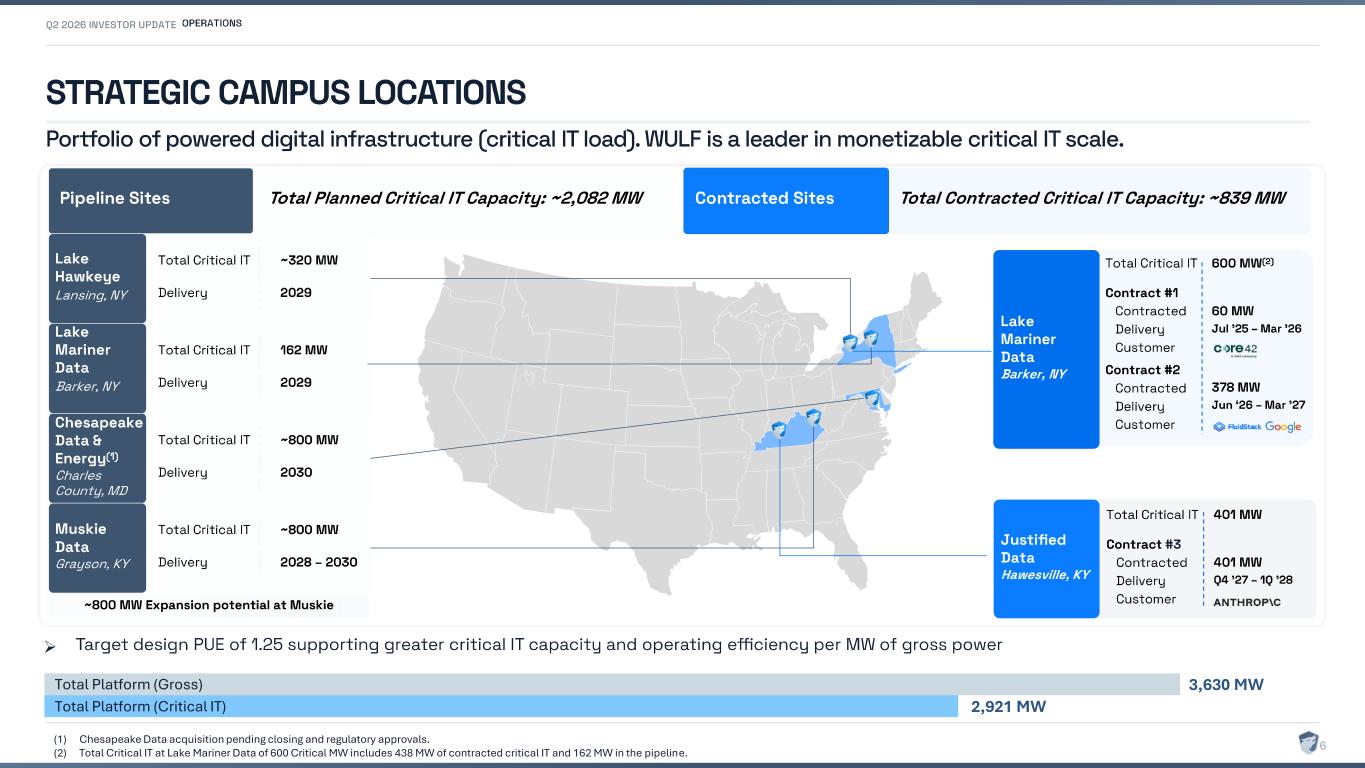
STRATEGIC CAMPUS LOCATIONS Portfolio of powered digital infrastructure (critical IT load). WULF is a leader in monetizable critical IT scale . ➢ Target design PUE of 1.25 supporting greater critical IT capacity and operating efficiency per MW of gross power OPERATIONS z Pipeline Sites Total Planned Critical IT Capacity: ~2,082 MW Contracted Sites Total Contracted Critical IT Capacity: ~ 839 MW ~320 MW 2029 Total Critical IT Delivery Lake Hawkeye Lansing, NY Chesapeake Data & Energy (1) Charles County, MD ~800 MW 2030 Total Critical IT Delivery Muskie Data Grayson, KY ~800 MW Expansion potential at Muskie ~800 MW 2028 – 2030 Total Critical IT Delivery Lake Mariner Data Barker, NY Total Critical IT Contract #1 Contracted Delivery Customer Contract #2 Contracted Delivery Customer 600 MW (2) 60 MW Jul ’25 – Mar ’26 378 MW Jun ‘26 – Mar ’27 Justified Data Hawesville, KY Total Critical IT Contract #3 Contracted Delivery Customer 401 MW 401 MW Q4 ’ 27 – 1Q ’28 2,921 MW 3,630 MWTotal Platform (Gross) Total Platform (Critical IT) 6(1) Chesapeake Data acquisition pending closing and regulatory approvals. (2) Total Critical IT at Lake Mariner Data of 600 Critical MW includes 438 MW of contracted critical IT and 162 MW in the pipeline. Lake Mariner Data Barker, NY 162 MW 2029 Total Critical IT Delivery
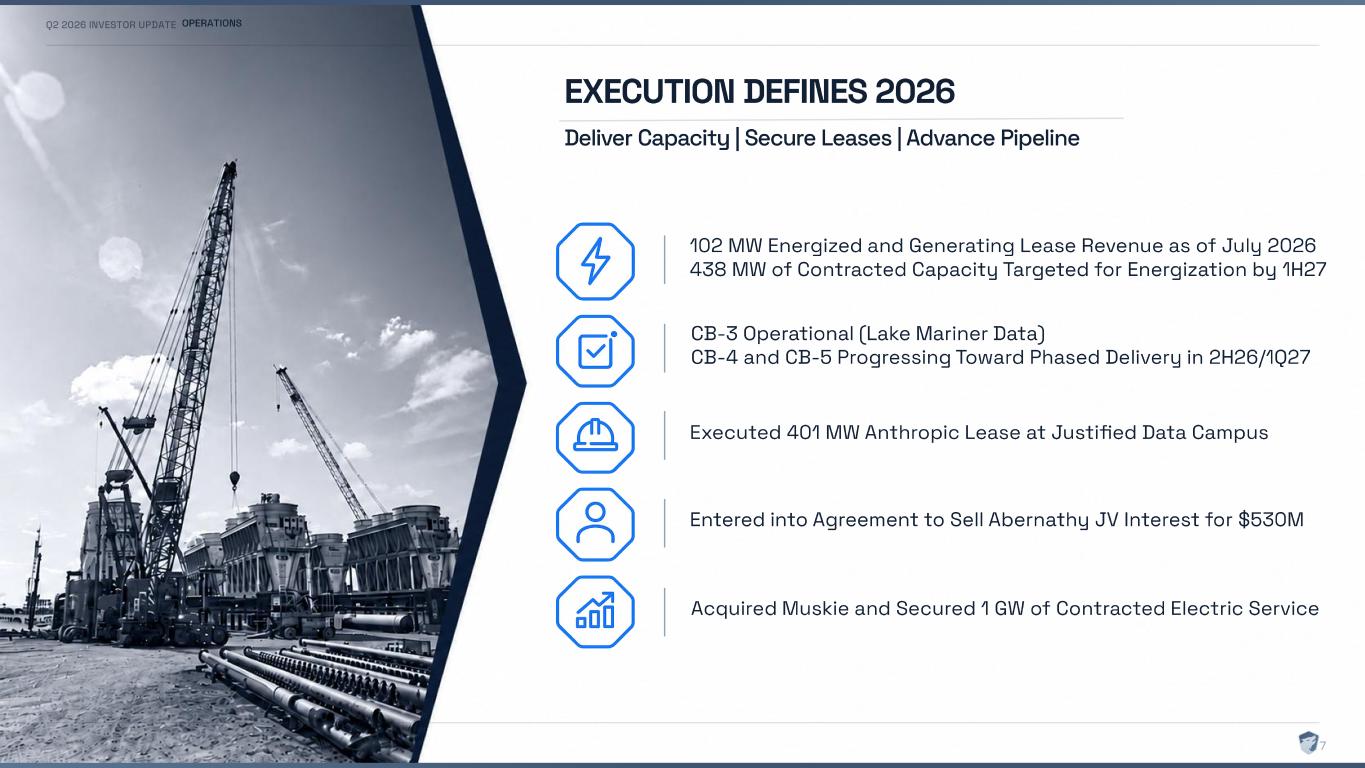
EXECUTION DEFINES 2026 Deliver Capacity | Secure Leases | Advance Pipeline 102 MW Energized and Generating Lease Revenue as of July 2026 438 MW of Contracted Capacity Targeted for Energization by 1H27 CB - 3 Operational (Lake Mariner Data) CB - 4 and CB - 5 Progressing Toward Phased Delivery in 2H26/1Q27 Executed 401 MW Anthropic Lease at Justified Data Campus Entered into Agreement to Sell Abernathy JV Interest for $530M OPERATIONS Acquired Muskie and Secured 1 GW of Contracted Electric Service 7
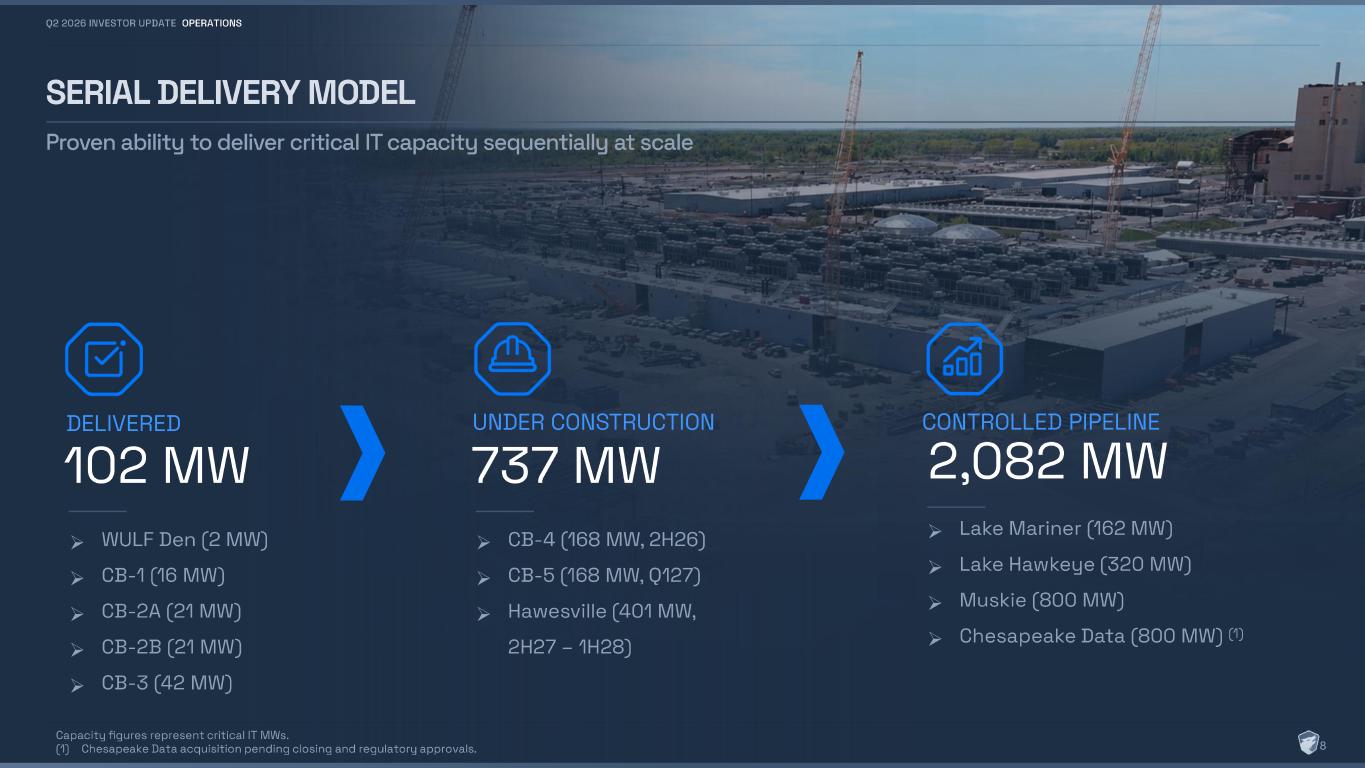
SERIAL DELIVERY MODEL Proven ability to deliver critical IT capacity sequentially at scale ➢ WULF Den (2 MW) ➢ CB - 1 (16 MW) ➢ CB - 2A (21 MW) ➢ CB - 2B (21 MW) ➢ CB - 3 (42 MW) DELIVERED UNDER CONSTRUCTION CONTROLLED PIPELINE ➢ CB - 4 (168 MW, 2H26) ➢ CB - 5 (168 MW, Q127) ➢ Hawesville (401 MW, 2H27 – 1H28) ➢ Lake Mariner (162 MW) ➢ Lake Hawkeye (320 MW) ➢ Muskie (800 MW) ➢ Chesapeake Data (800 MW) (1) Capacity figures represent critical IT MWs. (1) Chesapeake Data acquisition pending closing and regulatory approvals. 102 MW 737 MW 2,082 MW Q2 2026 INVESTOR UPDATE OPERATIONS 8
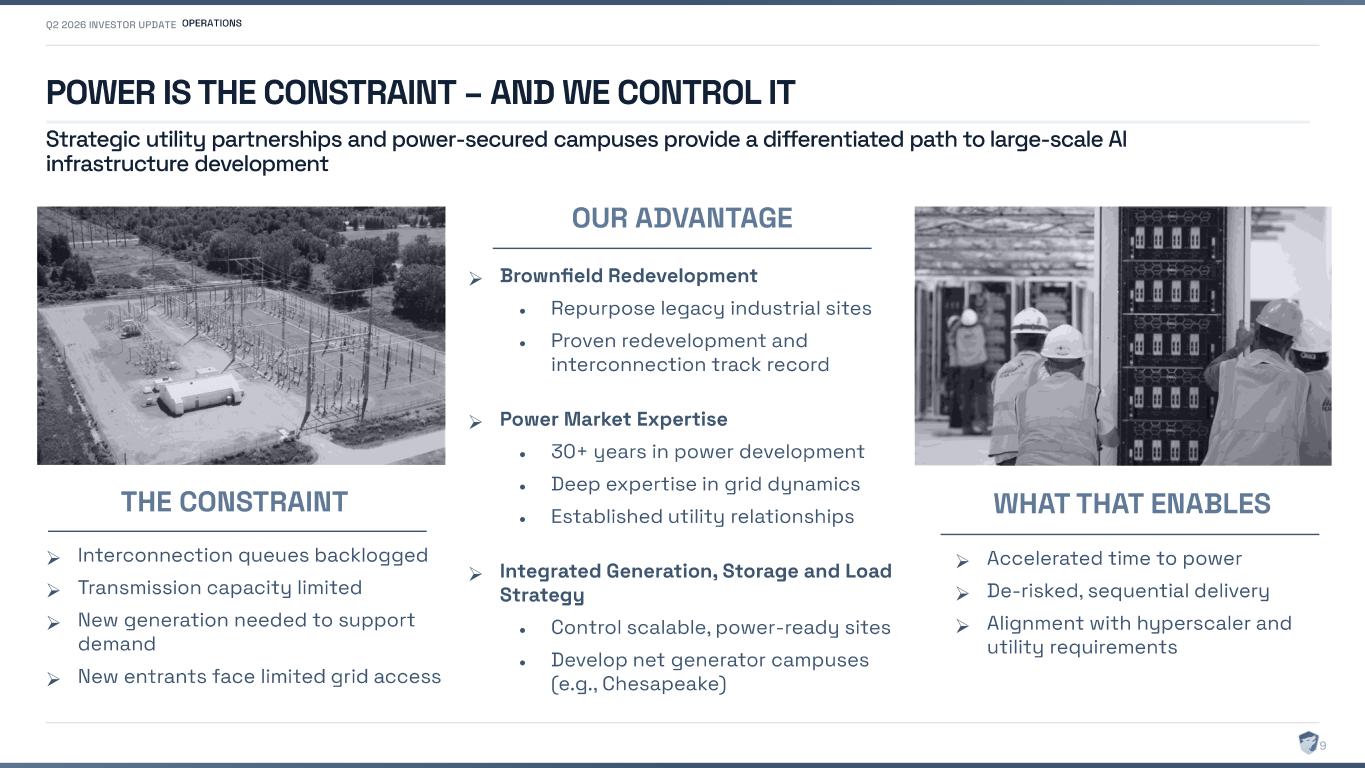
POWER IS THE CONSTRAINT – AND WE CONTROL IT Strategic utility partnerships and power -secured campuses provide a differentiated path to large -scale AI infrastructure development THE CONSTRAINT OUR ADVANTAGE ➢ Brownfield Redevelopment • Repurpose legacy industrial sites • Proven redevelopment and interconnection track record ➢ Power Market Expertise • 30+ years in power development • Deep expertise in grid dynamics • Established utility relationships ➢ Integrated Generation, Storage and Load Strategy • Control scalable, power - ready sites • Develop net generator campuses (e.g., Chesapeake) ➢ Interconnection queues backlogged ➢ Transmission capacity limited ➢ New generation needed to support demand ➢ New entrants face limited grid access ➢ Accelerated time to power ➢ De - risked, sequential delivery ➢ Alignment with hyperscaler and utility requirements WHAT THAT ENABLES OPERATIONS 9
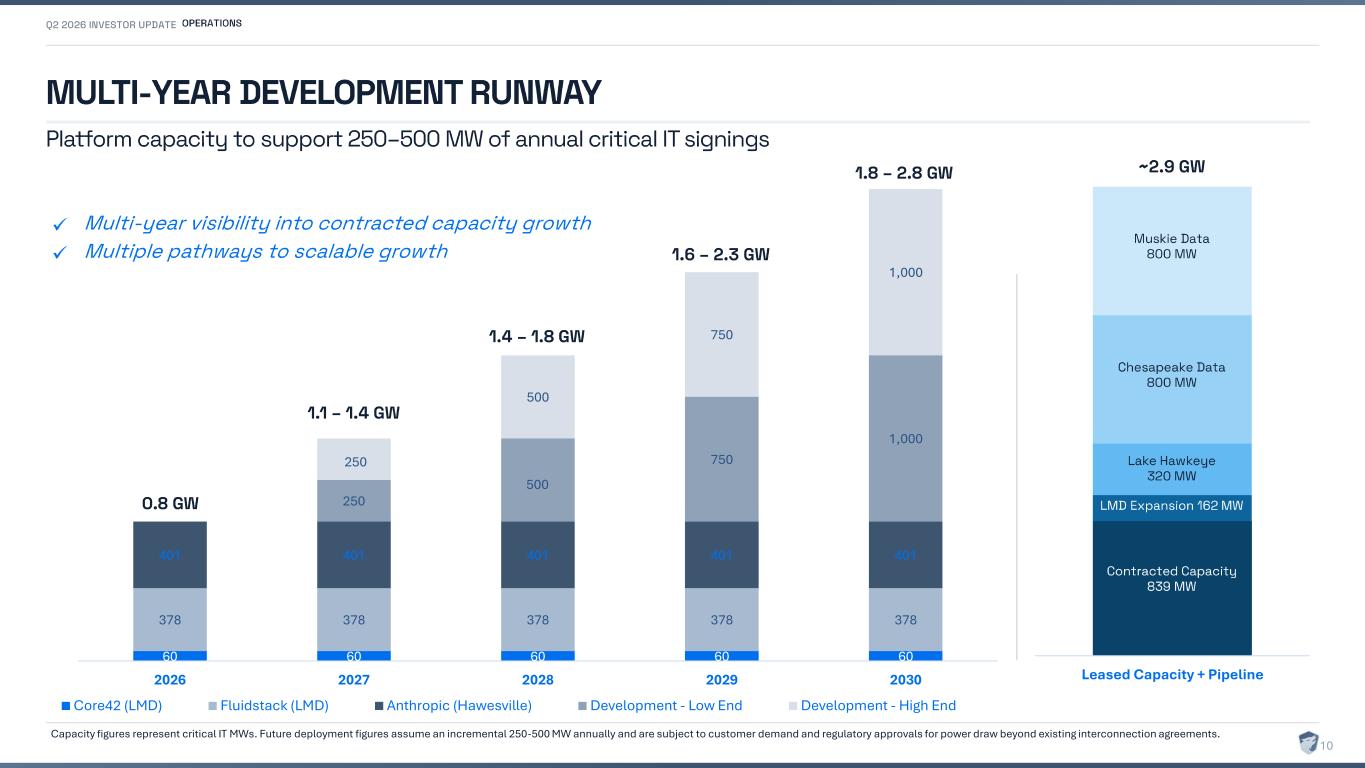
MULTI-YEAR DEVELOPMENT RUNWAY Platform capacity to support 250 –500 MW of annual critical IT signings OPERATIONS 60 60 60 60 60 378 378 378 378 378 401 401 401 401 401 250 500 750 1,000 250 500 750 1,000 2026 2027 2028 2029 2030 Core42 (LMD) Fluidstack (LMD) Anthropic (Hawesville) Development - Low End Development - High End 1.1 – 1.4 GW 1.4 – 1.8 GW 1.6 – 2.3 GW 0.8 GW 1.8 – 2.8 GW ✓ Multi - year visibility into contracted capacity growth ✓ Multiple pathways to scalable growth Leased Capacity + Pipeline Contracted Capacity 839 MW LMD Expansion 162 MW Lake Hawkeye 320 MW Chesapeake Data 800 MW Muskie Data 800 MW ~2.9 GW Capacity figures represent critical IT MWs. Future deployment figures assume an incremental 250-500 MW annually and are subject to customer demand and regulatory approvals for power draw beyond existing interconnection agreements. 10
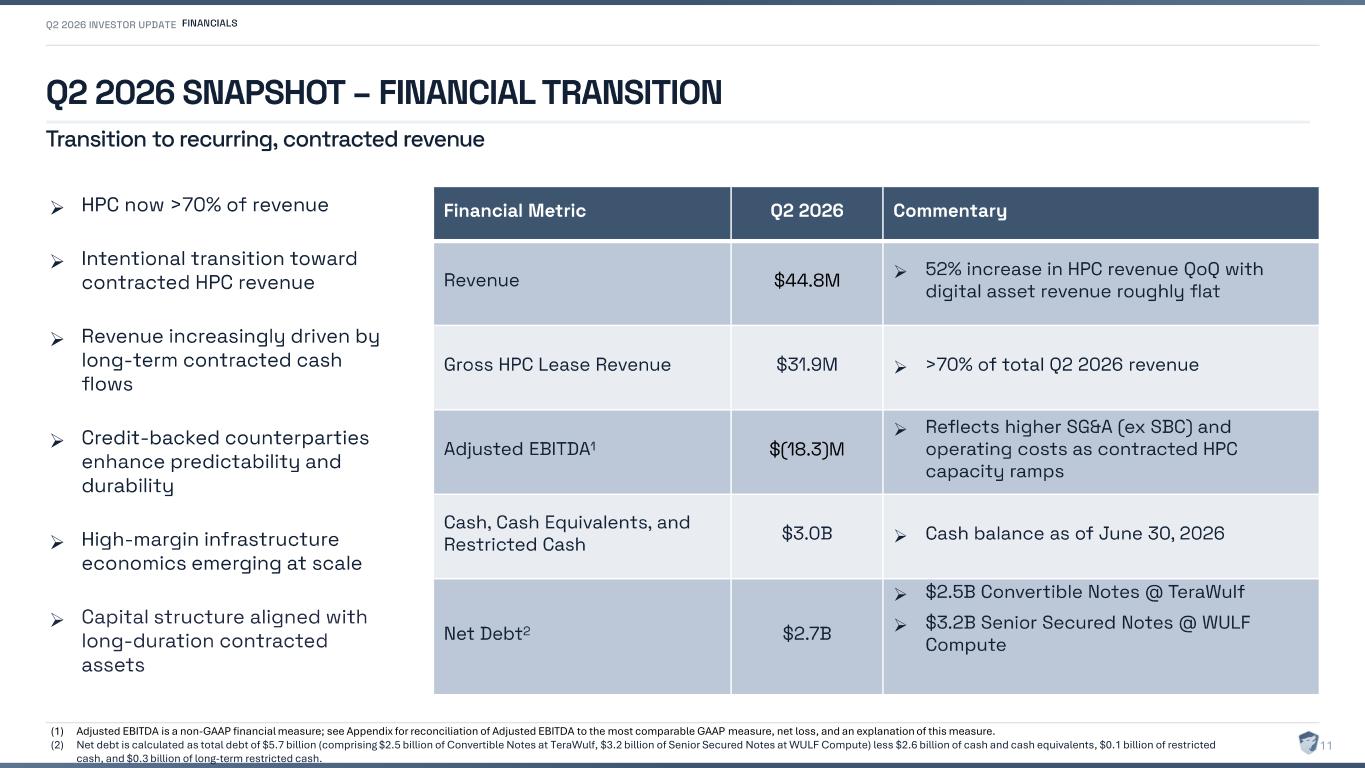
Q2 2026 SNAPSHOT – FINANCIAL TRANSITION Transition to recurring, contracted revenue Financial Metric Q2 2026 Commentary Revenue $44.8M ➢ 52% increase in HPC revenue QoQ with digital asset revenue roughly flat Gross HPC Lease Revenue $31.9M ➢ >70% of total Q2 2026 revenue Adjusted EBITDA 1 $(18.3)M ➢ Reflects higher SG&A (ex SBC) and operating costs as contracted HPC capacity ramps Cash, Cash Equivalents, and Restricted Cash $3.0B ➢ Cash balance as of June 30, 2026 Net Debt 2 $2.7B ➢ $2.5B Convertible Notes @ TeraWulf ➢ $3.2B Senior Secured Notes @ WULF Compute (1) Adjusted EBITDA is a non-GAAP financial measure; see Appendix for reconciliation of Adjusted EBITDA to the most comparable GAAP measure, net loss, and an explanation of this measure. (2) Net debt is calculated as total debt of $5.7 billion (comprising $2.5 billion of Convertible Notes at TeraWulf, $3.2 billion of Senior Secured Notes at WULF Compute) less $2.6 billion of cash and cash equivalents, $0.1 billion of restricted cash, and $0.3 billion of long-term restricted cash. ➢ HPC now >70% of revenue ➢ Intentional transition toward contracted HPC revenue ➢ Revenue increasingly driven by long - term contracted cash flows ➢ Credit - backed counterparties enhance predictability and durability ➢ High - margin infrastructure economics emerging at scale ➢ Capital structure aligned with long - duration contracted assets FINANCIALS 11
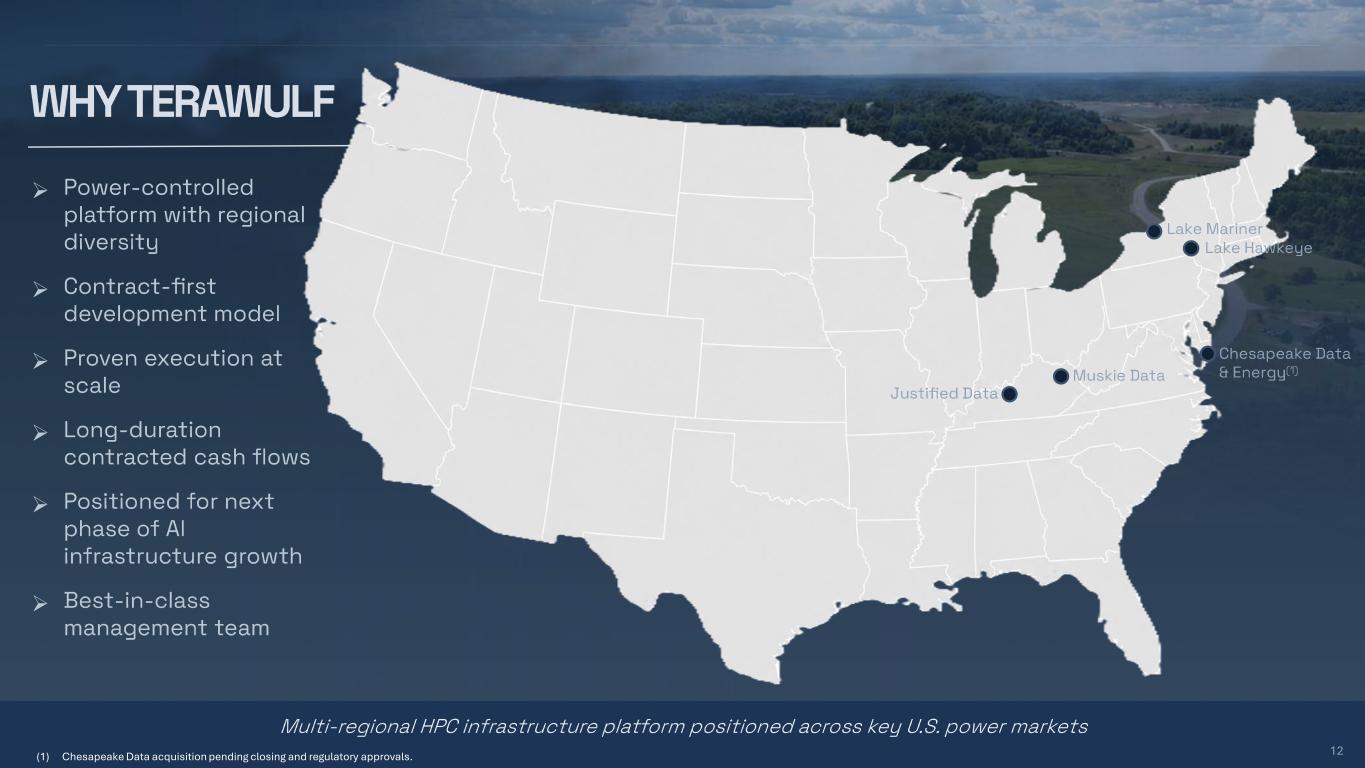
➢ Power - controlled platform with regional diversity ➢ Contract - first development model ➢ Proven execution at scale ➢ Long - duration contracted cash flows ➢ Positioned for next phase of AI infrastructure growth ➢ Best - in- class management team Lake Mariner Lake Hawkeye Chesapeake Data & Energy (1) Justified Data Muskie Data WHY TERAWULF Multi - regional HPC infrastructure platform positioned across key U.S. power markets 12(1) Chesapeake Data acquisition pending closing and regulatory approvals.
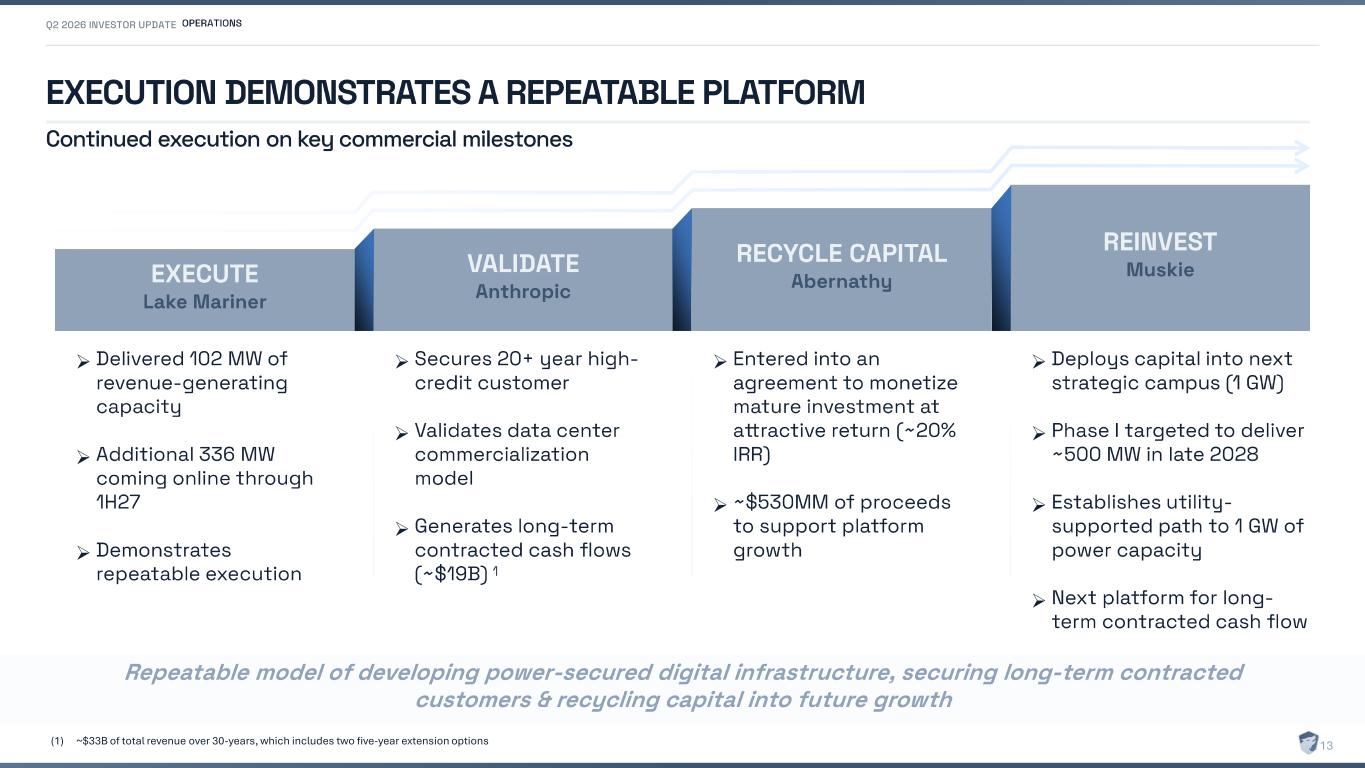
EXECUTION DEMONSTRATES A REPEATABLE PLATFORM Continued execution on key commercial milestones OPERATIONS EXECUTE Lake Mariner VALIDATE Anthropic RECYCLE CAPITAL Abernathy REINVEST Muskie ➢ Delivered 102 MW of revenue - generating capacity ➢ Additional 336 MW coming online through 1H27 ➢ Demonstrates repeatable execution ➢ Secures 20+ year high - credit customer ➢ Validates data center commercialization model ➢ Generates long - term contracted cash flows (~$19B) 1 ➢ Entered into an agreement to monetize mature investment at attractive return (~20% IRR) ➢ ~$530MM of proceeds to support platform growth ➢ Deploys capital into next strategic campus (1 GW) ➢ Phase I targeted to deliver ~500 MW in late 2028 ➢ Establishes utility - supported path to 1 GW of power capacity ➢ Next platform for long - term contracted cash flow (1) ~$33B of total revenue over 30-years, which includes two five-year extension options Repeatable model of developing power - secured digital infrastructure, securing long - term contracted customers & recycling capital into future growth 13
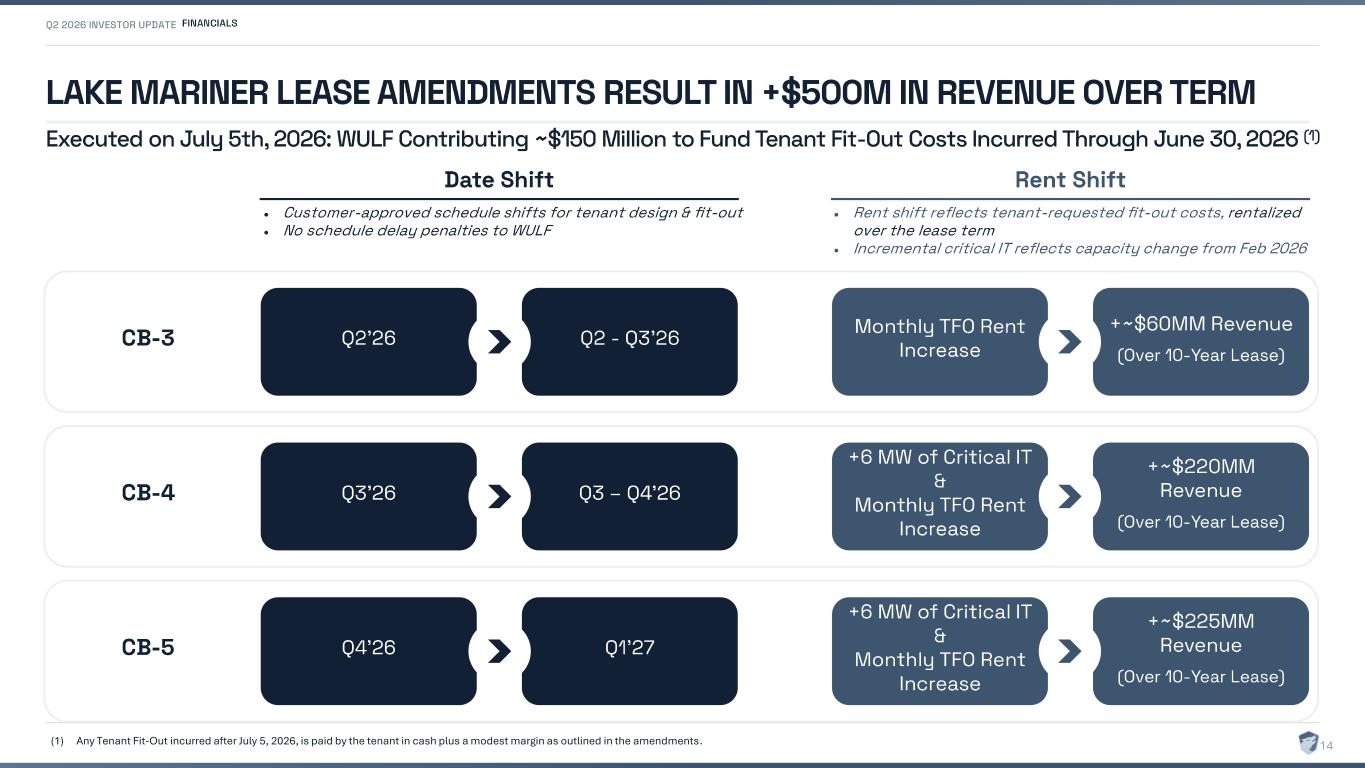
LAKE MARINER LEASE AMENDMENTS RESULT IN +$500M IN REVENUE OVER TERM Executed on July 5th, 2026: WULF Contributing ~$150 Million to Fund Tenant Fit -Out Costs Incurred Through June 30, 2026 (1) FINANCIALS Date Shift Rent Shift CB - 3 Q2’26 Monthly TFO Rent Increase Q2 - Q3’26 +~$60MM Revenue (Over 10 - Year Lease) CB - 4 Q3’26 +6 MW of Critical IT & Monthly TFO Rent Increase Q3 – Q4’26 +~$220MM Revenue (Over 10 - Year Lease) CB - 5 Q4’26 +6 MW of Critical IT & Monthly TFO Rent Increase Q1’27 +~$225MM Revenue (Over 10 - Year Lease) • Customer - approved schedule shifts for tenant design & fit - out • No schedule delay penalties to WULF • Rent shift reflects tenant - requested fit - out costs, rentalized over the lease term • Incremental critical IT reflects capacity change from Feb 2026 (1) Any Tenant Fit-Out incurred after July 5, 2026, is paid by the tenant in cash plus a modest margin as outlined in the amendments. 14
APPENDIX 15
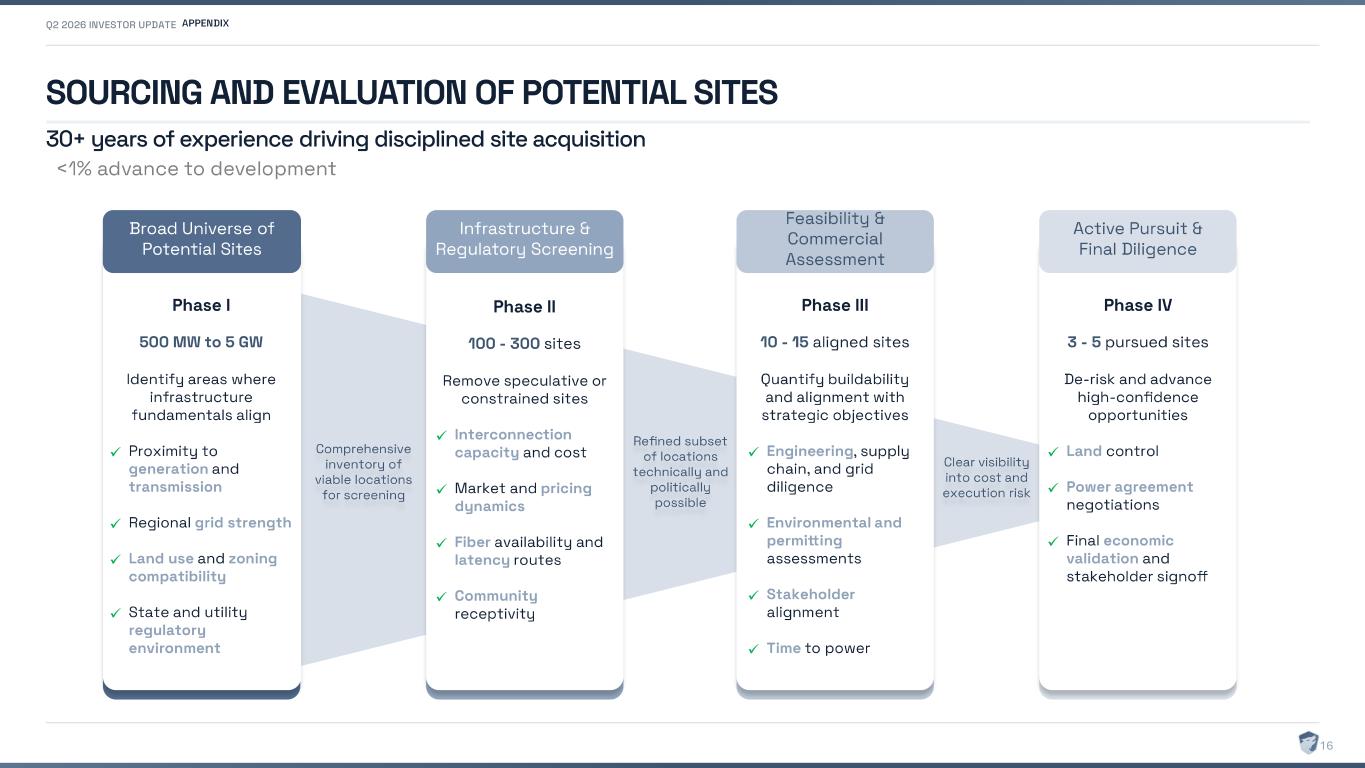
SOURCING AND EVALUATION OF POTENTIAL SITES 30+ years of experience driving disciplined site acquisition Broad Universe of Potential Sites Broad Universe of Potential Sites Broad Universe of Potential Sites Broad Universe of Potential Sites Broad Universe of Potential Sites Infrastructure & Regulatory Screening Feasibility & Commercial Assessment Active Pursuit & Final Diligence Phase I 500 MW to 5 GW Identify areas where infrastructure fundamentals align ✓ Proximity to generation and transmission ✓ Regional grid strength ✓ Land use and zoning compatibility ✓ State and utility regulatory environment Phase II 100 - 300 sites Remove speculative or constrained sites ✓ Interconnection capacity and cost ✓ Market and pricing dynamics ✓ Fiber availability and latency routes ✓ Community receptivity Phase III 10 - 15 aligned sites Quantify buildability and alignment with strategic objectives ✓ Engineering , supply chain, and grid diligence ✓ Environmental and permitting assessments ✓ Stakeholder alignment ✓ Time to power Phase IV 3 - 5 pursued sites De - risk and advance high - confidence opportunities ✓ Land control ✓ Power agreement negotiations ✓ Final economic validation and stakeholder signoff Refined subset of locations technically and politically possible Comprehensive inventory of viable locations for screening Clear visibility into cost and execution risk <1% advance to development APPENDIX 16
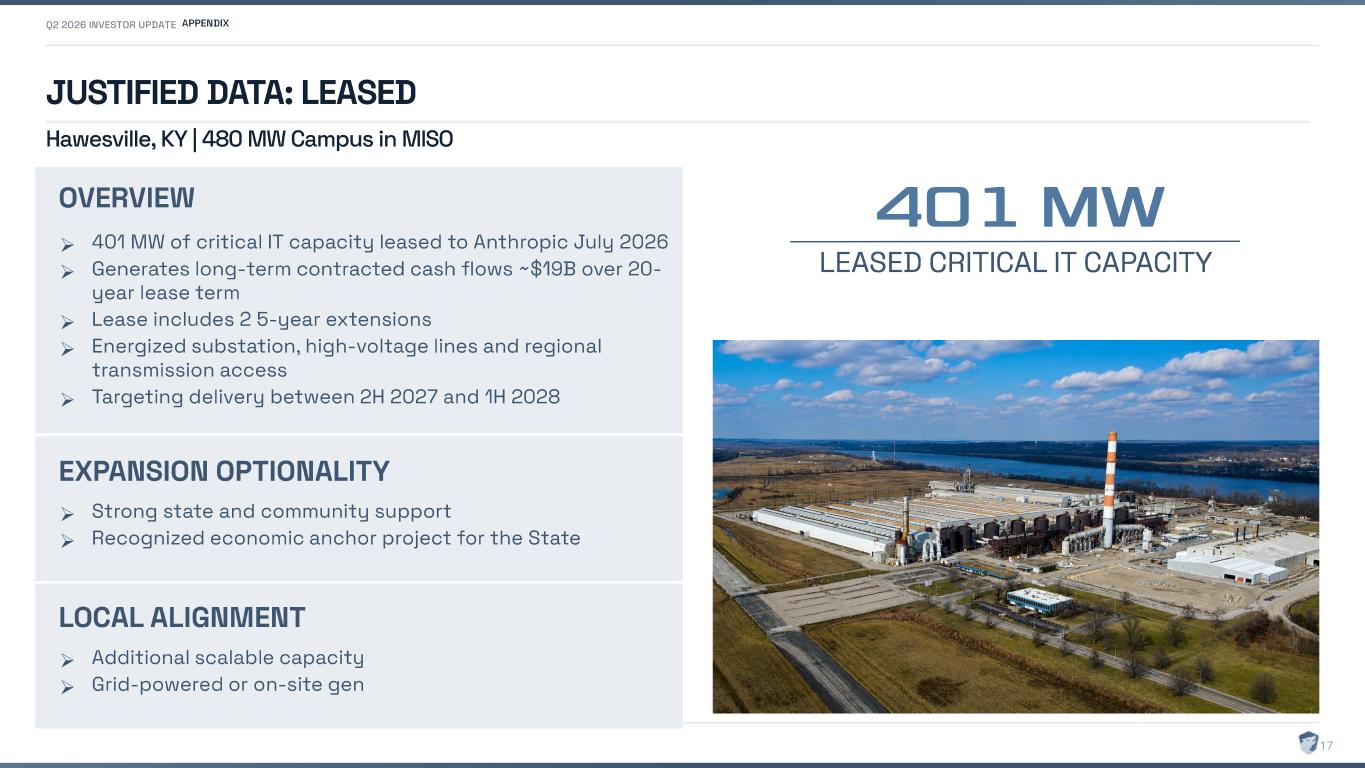
JUSTIFIED DATA: LEASED Hawesville, KY | 480 MW Campus in MISO 401 MW LEASED CRITICAL IT CAPACITY ➢ Strong state and community support ➢ Recognized economic anchor project for the State EXPANSION OPTIONALITY ➢ 401 MW of critical IT capacity leased to Anthropic July 2026 ➢ Generates long - term contracted cash flows ~$19B over 20 - year lease term ➢ Lease includes 2 5 - year extensions ➢ Energized substation, high - voltage lines and regional transmission access ➢ Targeting delivery between 2H 2027 and 1H 2028 OVERVIEW APPENDIX ➢ Additional scalable capacity ➢ Grid - powered or on - site gen LOCAL ALIGNMENT 17
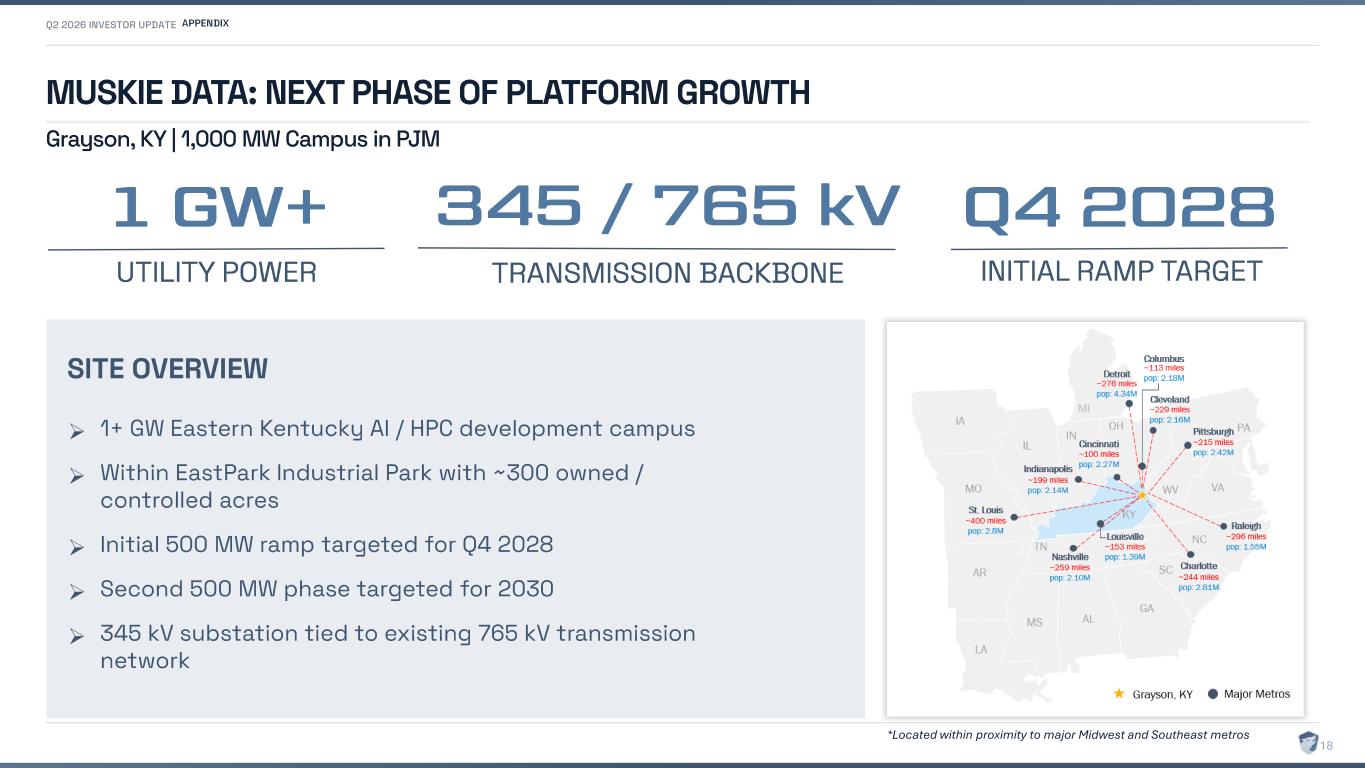
MUSKIE DATA: NEXT PHASE OF PLATFORM GROWTH Grayson, KY | 1,000 MW Campus in PJM ➢ 1+ GW Eastern Kentucky AI / HPC development campus ➢ Within EastPark Industrial Park with ~300 owned / controlled acres ➢ Initial 500 MW ramp targeted for Q4 2028 ➢ Second 500 MW phase targeted for 2030 ➢ 345 kV substation tied to existing 765 kV transmission network SITE OVERVIEW 1 GW+ UTILITY POWER 345 / 765 kV TRANSMISSION BACKBONE Q4 2028 INITIAL RAMP TARGET APPENDIX *Located within proximity to major Midwest and Southeast metros 18
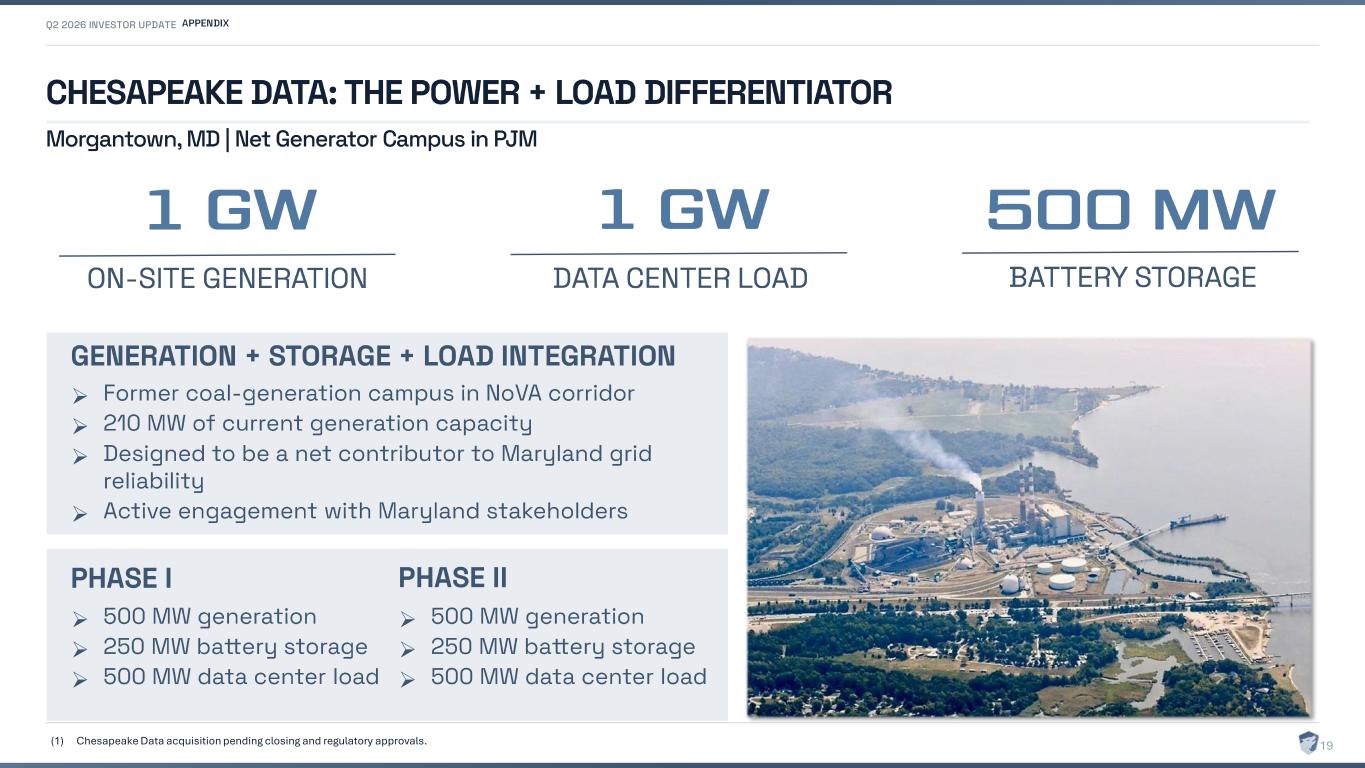
CHESAPEAKE DATA: THE POWER + LOAD DIFFERENTIATOR Morgantown, MD | Net Generator Campus in PJM ➢ 500 MW generation ➢ 250 MW battery storage ➢ 500 MW data center load PHASE I ➢ Former coal - generation campus in NoVA corridor ➢ 210 MW of current generation capacity ➢ Designed to be a net contributor to Maryland grid reliability ➢ Active engagement with Maryland stakeholders GENERATION + STORAGE + LOAD INTEGRATION 1 GW ON- SITE GENERATION 1 GW DATA CENTER LOAD 500 MW BATTERY STORAGE ➢ 500 MW generation ➢ 250 MW battery storage ➢ 500 MW data center load PHASE II APPENDIX (1) Chesapeake Data acquisition pending closing and regulatory approvals. 19
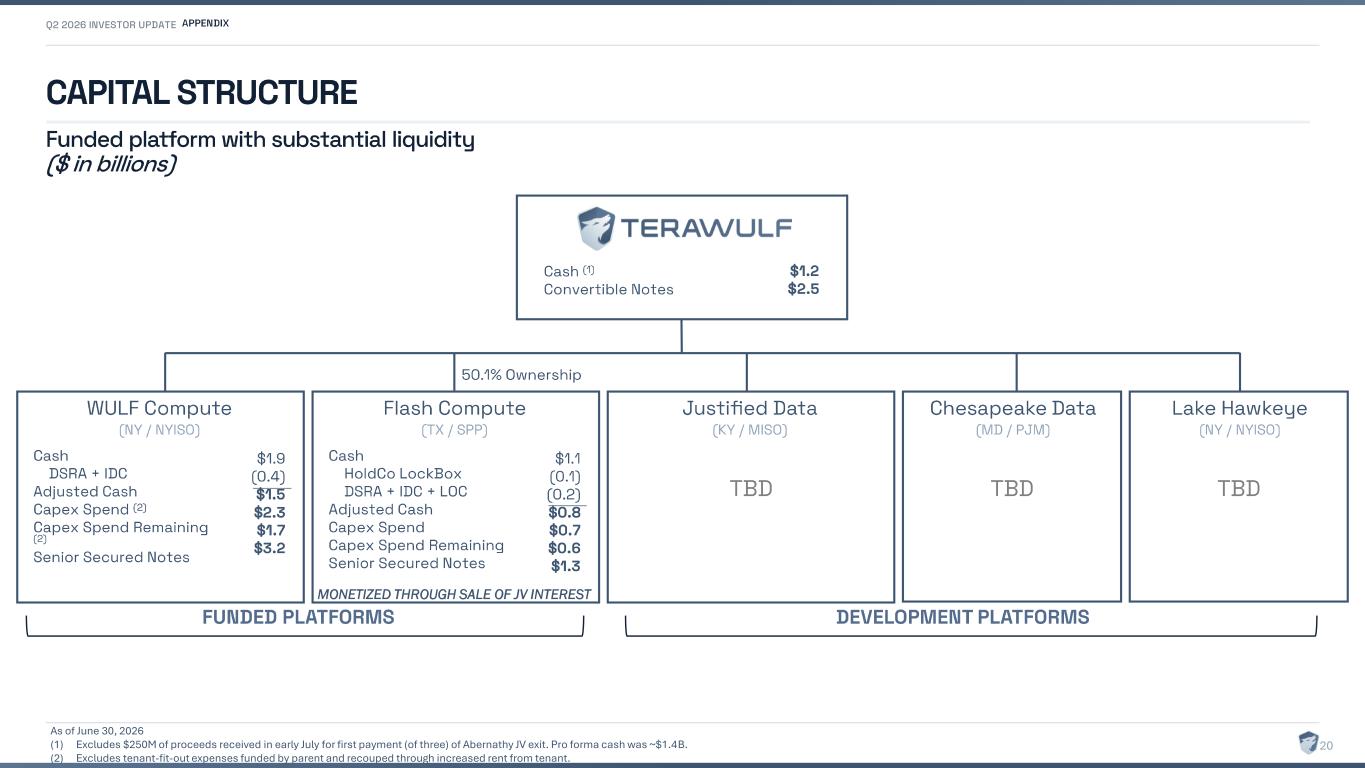
CAPITAL STRUCTURE Funded platform with substantial liquidity ($ in billions) As of June 30, 2026 (1) Excludes $250M of proceeds received in early July for first payment (of three) of Abernathy JV exit. Pro forma cash was ~$1.4B. (2) Excludes tenant-fit-out expenses funded by parent and recouped through increased rent from tenant. Cash (1) Convertible Notes $1.2 $2.5 50.1% Ownership WULF Compute (NY / NYISO) Cash DSRA + IDC Adjusted Cash Capex Spend (2) Capex Spend Remaining (2) Senior Secured Notes $1.9 (0.4) $1.5 $2.3 $1.7 $3.2 $1,479 (100) (225 TBD $268 $1,087 $1,300 Chesapeake Data (MD / PJM) $1,479 (100) (225) TBD $268 $1,087 $1,300 Lake Hawkeye (NY / NYISO) FUNDED PLATFORMS TBD Justified Data (KY / MISO) APPENDIX 20 Flash Compute (TX / SPP) Cash HoldCo LockBox DSRA + IDC + LOC Adjusted Cash Capex Spend Capex Spend Remaining Senior Secured Notes $1.1 (0.1) (0.2) $0.8 $0.7 $0.6 $1.3 DEVELOPMENT PLATFORMS MONETIZED THROUGH SALE OF JV INTEREST
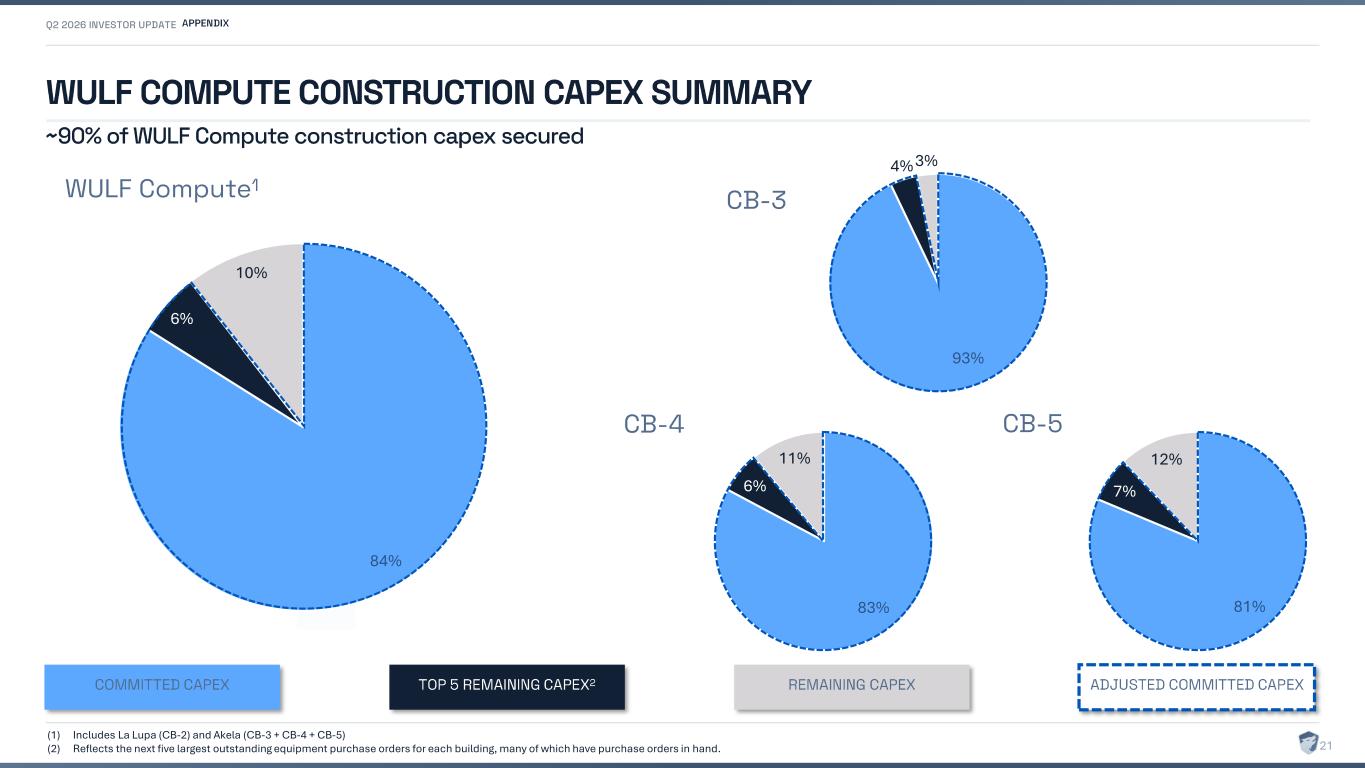
93% 4%3% WULF COMPUTE CONSTRUCTION CAPEX SUMMARY COMMITTED CAPEX TOP 5 REMAINING CAPEX 2 REMAINING CAPEX ADJUSTED COMMITTED CAPEX WULF Compute 1 CB - 3 CB - 4 CB - 5 (1) Includes La Lupa (CB-2) and Akela (CB-3 + CB-4 + CB-5) (2) Reflects the next five largest outstanding equipment purchase orders for each building, many of which have purchase orders in hand. APPENDIX ~90% of WULF Compute construction capex secured 84% 6% 10% 83% 6% 11% 81% 7% 12% 21
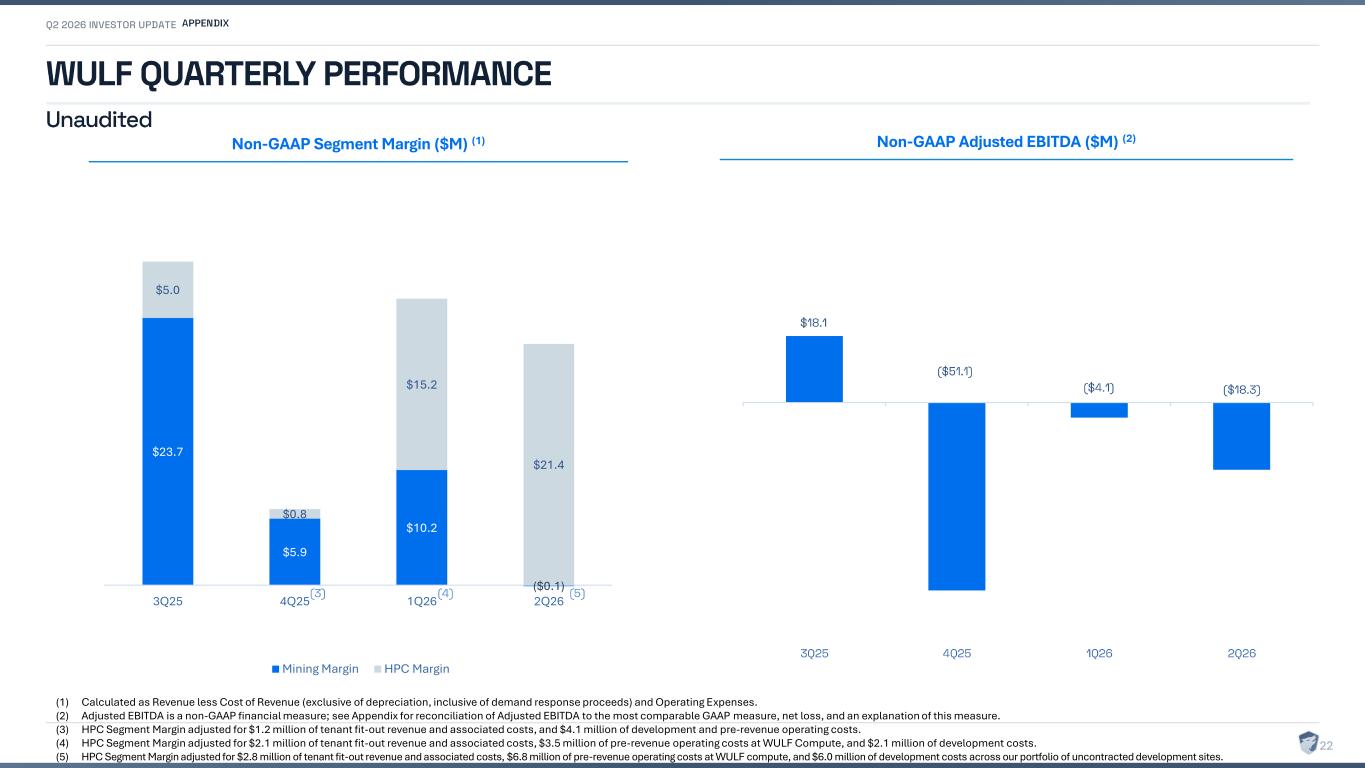
WULF QUARTERLY PERFORMANCE $23.7 $5.9 $10.2 ($0.1) $5.0 $0.8 $15.2 $21.4 3Q25 4Q25 1Q26 2Q26 Mining Margin HPC Margin Non-GAAP Segment Margin ($M) (1) $18.1 ($51.1) ($4.1) ($18.3) 3Q25 4Q25 1Q26 2Q26 Non-GAAP Adjusted EBITDA ($M) (2) (1) Calculated as Revenue less Cost of Revenue (exclusive of depreciation, inclusive of demand response proceeds) and Operating Expenses. (2) Adjusted EBITDA is a non-GAAP financial measure; see Appendix for reconciliation of Adjusted EBITDA to the most comparable GAAP measure, net loss, and an explanation of this measure. (3) HPC Segment Margin adjusted for $1.2 million of tenant fit-out revenue and associated costs, and $4.1 million of development and pre-revenue operating costs. (4) HPC Segment Margin adjusted for $2.1 million of tenant fit-out revenue and associated costs, $3.5 million of pre-revenue operating costs at WULF Compute, and $2.1 million of development costs. (5) HPC Segment Margin adjusted for $2.8 million of tenant fit-out revenue and associated costs, $6.8 million of pre-revenue operating costs at WULF compute, and $6.0 million of development costs across our portfolio of uncontracted development sites. (3) (4) APPENDIX 22 Unaudited (5)
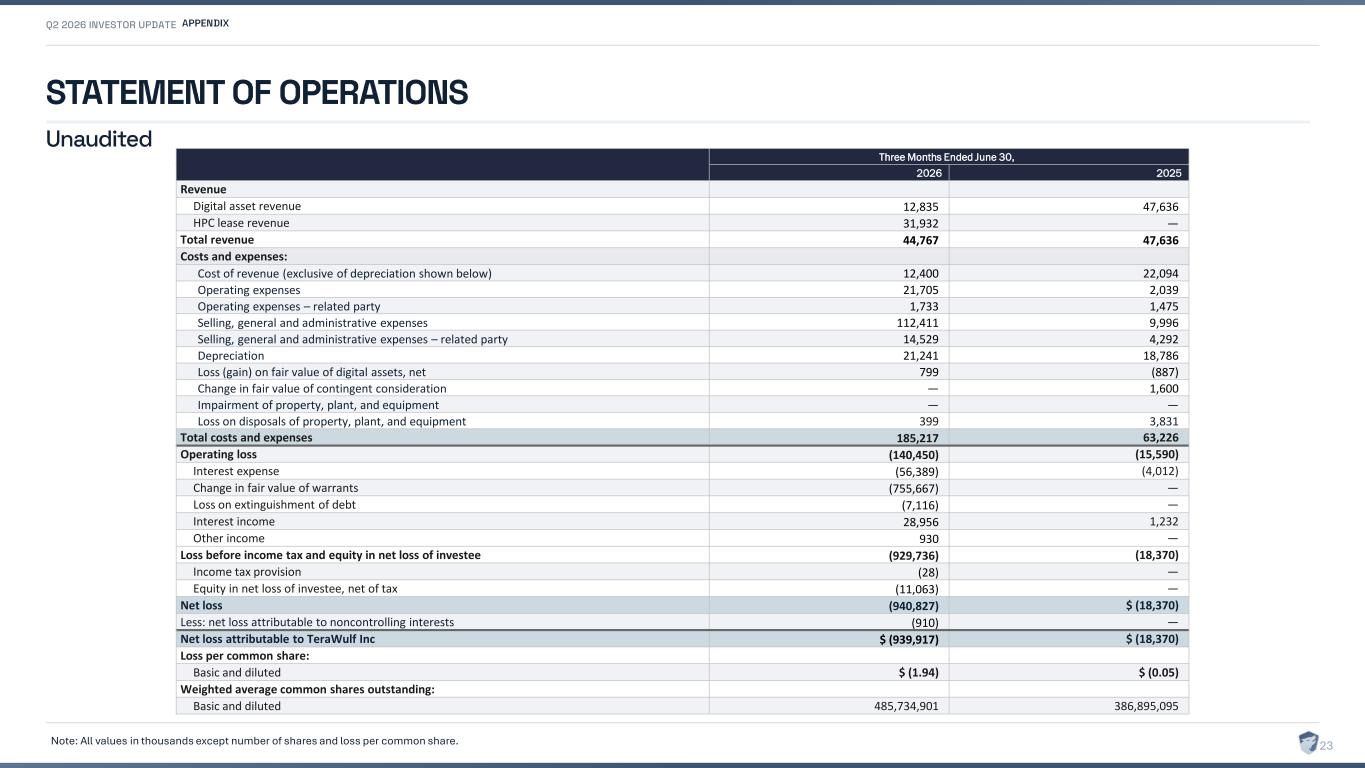
STATEMENT OF OPERATIONS APPENDIX 23 Three Months Ended June 30, 2026 2025 Revenue Digital asset revenue 12,835 47,636 HPC lease revenue 31,932 — Total revenue 44,767 47,636 Costs and expenses: Cost of revenue (exclusive of depreciation shown below) 12,400 22,094 Operating expenses 21,705 2,039 Operating expenses – related party 1,733 1,475 Selling, general and administrative expenses 112,411 9,996 Selling, general and administrative expenses – related party 14,529 4,292 Depreciation 21,241 18,786 Loss (gain) on fair value of digital assets, net 799 (887) Change in fair value of contingent consideration — 1,600 Impairment of property, plant, and equipment — — Loss on disposals of property, plant, and equipment 399 3,831 Total costs and expenses 185,217 63,226 Operating loss (140,450) (15,590) Interest expense (56,389) (4,012) Change in fair value of warrants (755,667) — Loss on extinguishment of debt (7,116) — Interest income 28,956 1,232 Other income 930 — Loss before income tax and equity in net loss of investee (929,736) (18,370) Income tax provision (28) — Equity in net loss of investee, net of tax (11,063) — Net loss (940,827) $ (18,370) Less: net loss attributable to noncontrolling interests (910) — Net loss attributable to TeraWulf Inc $ (939,917) $ (18,370) Loss per common share: Basic and diluted $ (1.94) $ (0.05) Weighted average common shares outstanding: Basic and diluted 485,734,901 386,895,095 Note: All values in thousands except number of shares and loss per common share. Unaudited
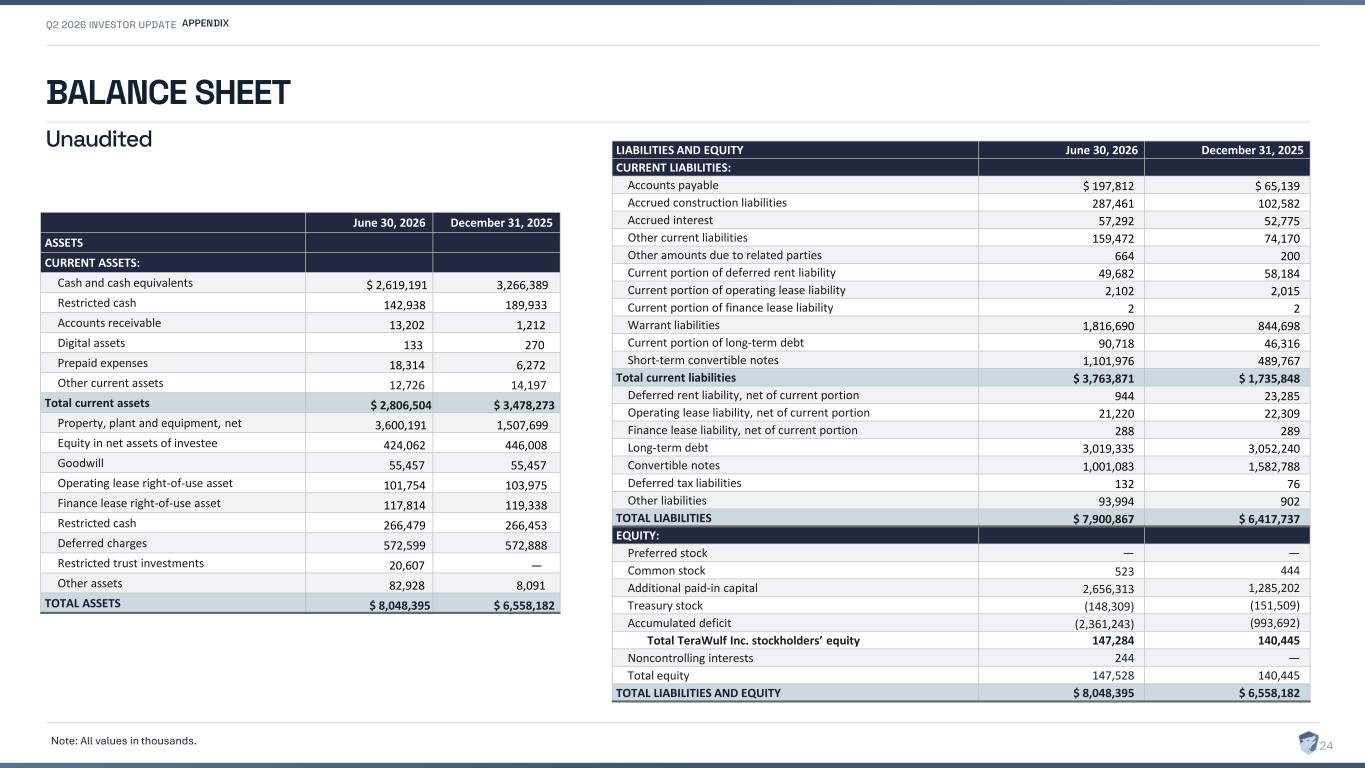
BALANCE SHEET APPENDIX 24 June 30, 2026 December 31, 2025 ASSETS CURRENT ASSETS: Cash and cash equivalents $ 2,619,191 3,266,389 Restricted cash 142,938 189,933 Accounts receivable 13,202 1,212 Digital assets 133 270 Prepaid expenses 18,314 6,272 Other current assets 12,726 14,197 Total current assets $ 2,806,504 $ 3,478,273 Property, plant and equipment, net 3,600,191 1,507,699 Equity in net assets of investee 424,062 446,008 Goodwill 55,457 55,457 Operating lease right-of-use asset 101,754 103,975 Finance lease right-of-use asset 117,814 119,338 Restricted cash 266,479 266,453 Deferred charges 572,599 572,888 Restricted trust investments 20,607 — Other assets 82,928 8,091 TOTAL ASSETS $ 8,048,395 $ 6,558,182 LIABILITIES AND EQUITY June 30, 2026 December 31, 2025 CURRENT LIABILITIES: Accounts payable $ 197,812 $ 65,139 Accrued construction liabilities 287,461 102,582 Accrued interest 57,292 52,775 Other current liabilities 159,472 74,170 Other amounts due to related parties 664 200 Current portion of deferred rent liability 49,682 58,184 Current portion of operating lease liability 2,102 2,015 Current portion of finance lease liability 2 2 Warrant liabilities 1,816,690 844,698 Current portion of long-term debt 90,718 46,316 Short-term convertible notes 1,101,976 489,767 Total current liabilities $ 3,763,871 $ 1,735,848 Deferred rent liability, net of current portion 944 23,285 Operating lease liability, net of current portion 21,220 22,309 Finance lease liability, net of current portion 288 289 Long-term debt 3,019,335 3,052,240 Convertible notes 1,001,083 1,582,788 Deferred tax liabilities 132 76 Other liabilities 93,994 902 TOTAL LIABILITIES $ 7,900,867 $ 6,417,737 EQUITY: Preferred stock — — Common stock 523 444 Additional paid-in capital 2,656,313 1,285,202 Treasury stock (148,309) (151,509) Accumulated deficit (2,361,243) (993,692) Total TeraWulf Inc. stockholders’ equity 147,284 140,445 Noncontrolling interests 244 — Total equity 147,528 140,445 TOTAL LIABILITIES AND EQUITY $ 8,048,395 $ 6,558,182 Note: All values in thousands. Unaudited
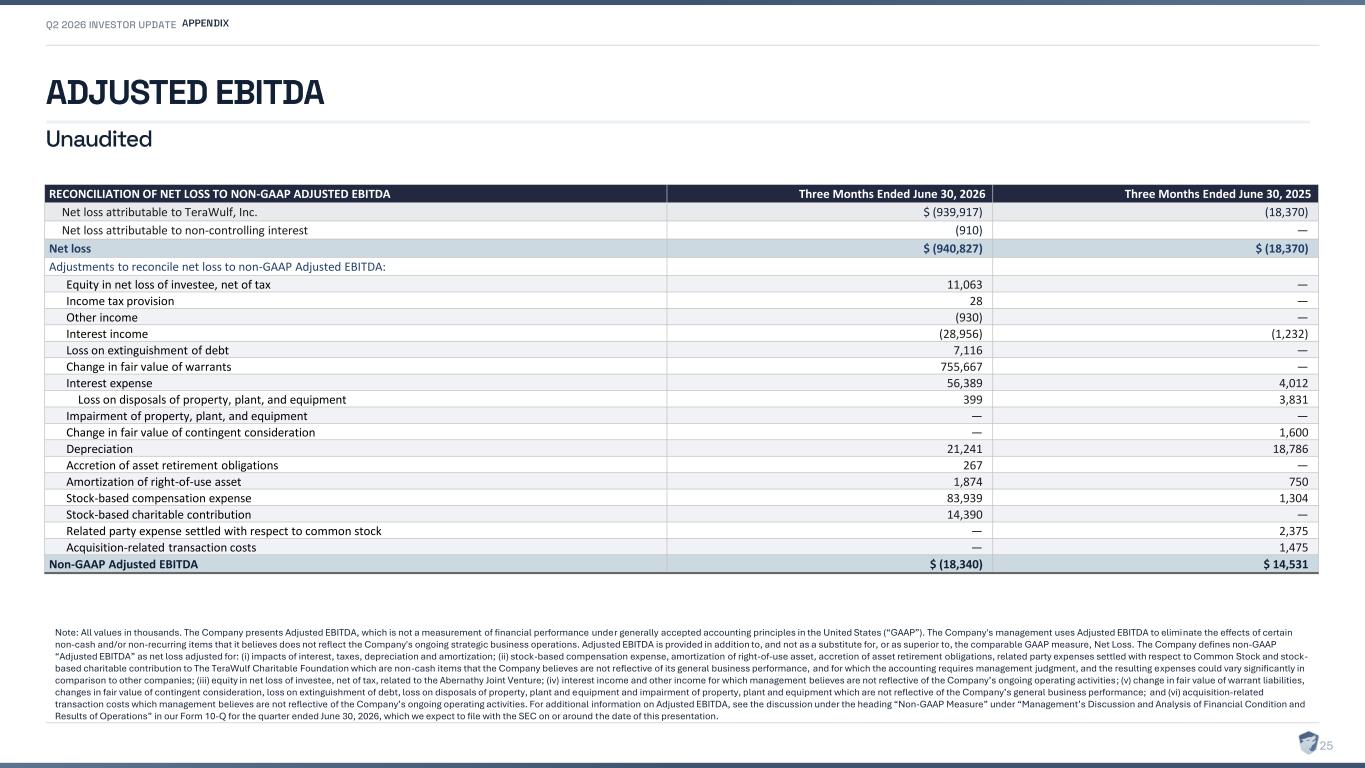
ADJUSTED EBITDA Note: All values in thousands. The Company presents Adjusted EBITDA, which is not a measurement of financial performance under generally accepted accounting principles in the United States (“GAAP”). The Company's management uses Adjusted EBITDA to eliminate the effects of certain non-cash and/or non-recurring items that it believes does not reflect the Company's ongoing strategic business operations. Adjusted EBITDA is provided in addition to, and not as a substitute for, or as superior to, the comparable GAAP measure, Net Loss. The Company defines non-GAAP “Adjusted EBITDA” as net loss adjusted for: (i) impacts of interest, taxes, depreciation and amortization; (ii) stock-based compensation expense, amortization of right-of-use asset, accretion of asset retirement obligations, related party expenses settled with respect to Common Stock and stock- based charitable contribution to The TeraWulf Charitable Foundation which are non-cash items that the Company believes are not reflective of its general business performance, and for which the accounting requires management judgment, and the resulting expenses could vary significantly in comparison to other companies; (iii) equity in net loss of investee, net of tax, related to the Abernathy Joint Venture; (iv) interest income and other income for which management believes are not reflective of the Company’s ongoing operating activities; (v) change in fair value of warrant liabilities, changes in fair value of contingent consideration, loss on extinguishment of debt, loss on disposals of property, plant and equipment and impairment of property, plant and equipment which are not reflective of the Company’s general business performance; and (vi) acquisition-related transaction costs which management believes are not reflective of the Company’s ongoing operating activities. For additional information on Adjusted EBITDA, see the discussion under the heading “Non-GAAP Measure” under “Management’s Discussion and Analysis of Financial Condition and Results of Operations” in our Form 10-Q for the quarter ended June 30, 2026, which we expect to file with the SEC on or around the date of this presentation. APPENDIX 25 RECONCILIATION OF NET LOSS TO NON-GAAP ADJUSTED EBITDA Three Months Ended June 30, 2026 Three Months Ended June 30, 2025 Net loss attributable to TeraWulf, Inc. $ (939,917) (18,370) Net loss attributable to non-controlling interest (910) — Net loss $ (940,827) $ (18,370) Adjustments to reconcile net loss to non-GAAP Adjusted EBITDA: Equity in net loss of investee, net of tax 11,063 — Income tax provision 28 — Other income (930) — Interest income (28,956) (1,232) Loss on extinguishment of debt 7,116 — Change in fair value of warrants 755,667 — Interest expense 56,389 4,012 Loss on disposals of property, plant, and equipment 399 3,831 Impairment of property, plant, and equipment — — Change in fair value of contingent consideration — 1,600 Depreciation 21,241 18,786 Accretion of asset retirement obligations 267 — Amortization of right-of-use asset 1,874 750 Stock-based compensation expense 83,939 1,304 Stock-based charitable contribution 14,390 — Related party expense settled with respect to common stock — 2,375 Acquisition-related transaction costs — 1,475 Non-GAAP Adjusted EBITDA $ (18,340) $ 14,531 Unaudited
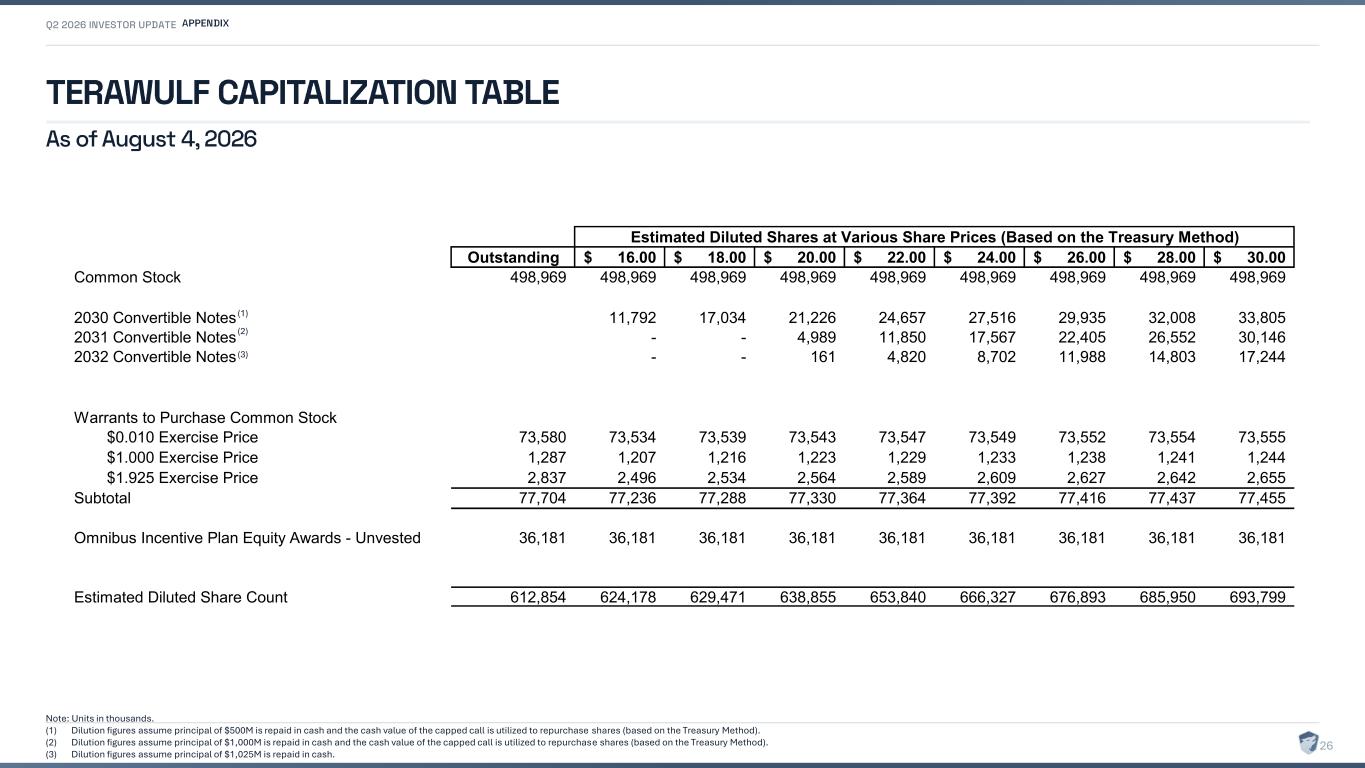
TERAWULF CAPITALIZATION TABLE As of August 4, 2026 Note: Units in thousands. (1) Dilution figures assume principal of $500M is repaid in cash and the cash value of the capped call is utilized to repurchase shares (based on the Treasury Method). (2) Dilution figures assume principal of $1,000M is repaid in cash and the cash value of the capped call is utilized to repurchase shares (based on the Treasury Method). (3) Dilution figures assume principal of $1,025M is repaid in cash. APPENDIX 26 Outstanding 16.00$ 18.00$ 20.00$ 22.00$ 24.00$ 26.00$ 28.00$ 30.00$ Common Stock 498,969 498,969 498,969 498,969 498,969 498,969 498,969 498,969 498,969 2030 Convertible Notes 11,792 17,034 21,226 24,657 27,516 29,935 32,008 33,805 2031 Convertible Notes - - 4,989 11,850 17,567 22,405 26,552 30,146 2032 Convertible Notes - - 161 4,820 8,702 11,988 14,803 17,244 Warrants to Purchase Common Stock $0.010 Exercise Price 73,580 73,534 73,539 73,543 73,547 73,549 73,552 73,554 73,555 $1.000 Exercise Price 1,287 1,207 1,216 1,223 1,229 1,233 1,238 1,241 1,244 $1.925 Exercise Price 2,837 2,496 2,534 2,564 2,589 2,609 2,627 2,642 2,655 Subtotal 77,704 77,236 77,288 77,330 77,364 77,392 77,416 77,437 77,455 Omnibus Incentive Plan Equity Awards - Unvested 36,181 36,181 36,181 36,181 36,181 36,181 36,181 36,181 36,181 Estimated Diluted Share Count 612,854 624,178 629,471 638,855 653,840 666,327 676,893 685,950 693,799 Estimated Diluted Shares at Various Share Prices (Based on the Treasury Method) (1) (2) (3)
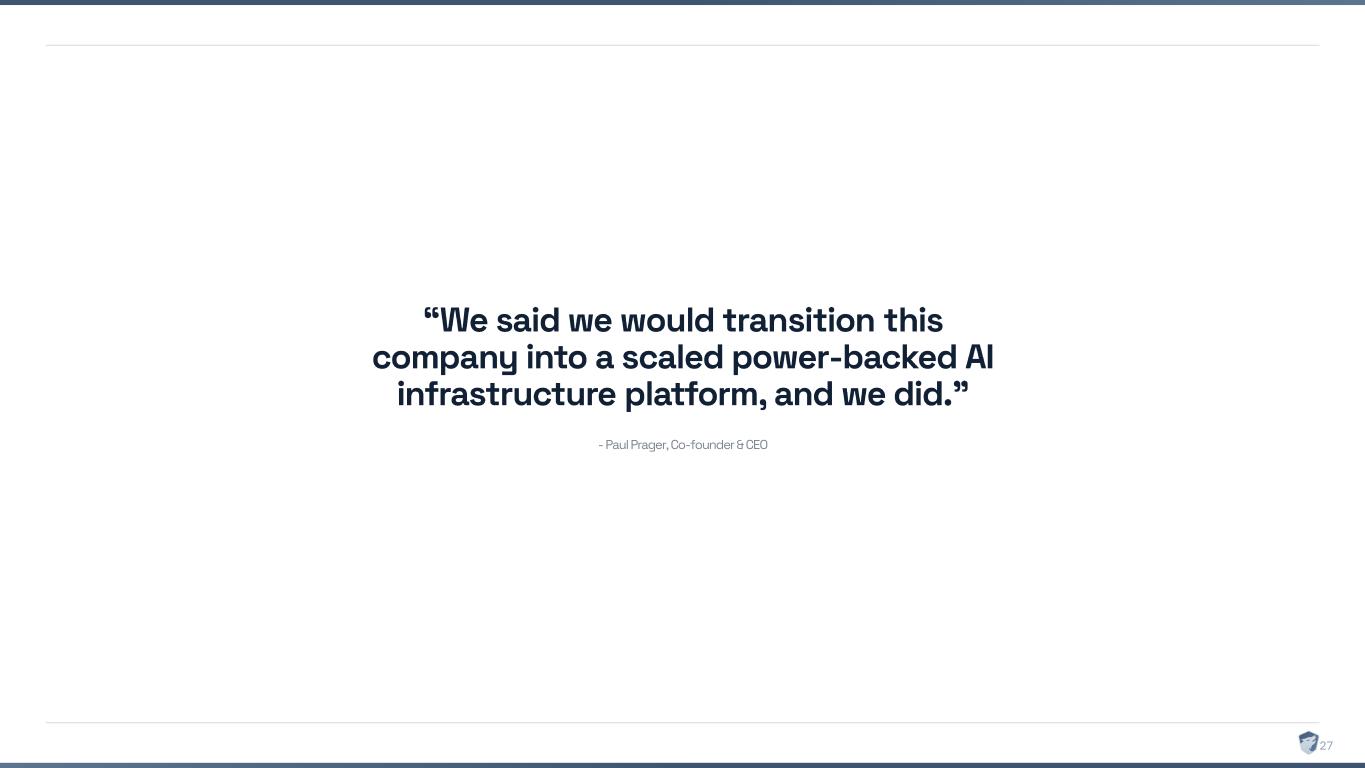
“We said we would transition this company into a scaled power -backed AI infrastructure platform, and we did." 27