EX-99.2
Published on
THE POWER OF INFRASTRUCTURE Q3 2026 INVESTOR UPDATE Q3 2026 BUSINESS UPDATE NOVEMBER 6, 2026
SAFE HARBOR STATEMENT SAFE HARBOR This presentation is for informational purposes only and contains forward-looking statements within the meaning of the “safe harbor” provisions of the Private Securities Litigation Reform Act of 1995, as amended. Such forward-looking statements include statements concerning anticipated future events and expectations that are not historical facts. All statements, other than statements of historical fact, are statements that could be deemed forward-looking statements. In addition, forward-looking statements are typically identified by words such as “plan,” “believe,” “goal,” “target,” “aim,” “expect,” “anticipate,” “intend,” “outlook,” “estimate,” “forecast,” “project,” “seek,” “continue,” “could,” “may,” “might,” “possible,” “potential,” “strategy,” “opportunity,” “predict,” “should,” “would” and other similar words and expressions, although the absence of these words or expressions does not mean that a statement is not forward- looking. Forward-looking statements are based on the current expectations and beliefs of TeraWulf’s management and are inherently subject to a number of factors, risks, uncertainties and assumptions and their potential effects. There can be no assurance that future developments will be those that have been anticipated. Actual results may vary materially from those expressed or implied by forward-looking statements based on a number of factors, risks, uncertainties and assumptions, including, among others: (1) TeraWulf’s ability to a ract additional customers to lease its HPC data centers; (2) TeraWulf’s ability to complete its data center campuses and future strategic growth initiatives in a timely manner or within anticipated cost estimates; (3) operational risks associated with its data centers and TeraWulf’s ability to perform under its existing data center lease agreements; (4) failure to obtain adequate financing on a timely basis and/or on acceptable terms with regard to expansion or existing operations; (5) changes in applicable laws, regulations and/or permits affecting TeraWulf’s operations or the industries in which it operates; (6) adverse geopolitical or economic conditions, including a high inflationary environment, the implementation of new tariffs and more restrictive trade regulations; (7) the potential of cybercrime, money-laundering, malware infections and phishing and/or loss and interference as a result of equipment malfunction or break-down, physical disaster, data security breach, computer malfunction or sabotage (and the costs associated with any of the foregoing); (8) the availability and cost of power as well as electrical infrastructure equipment necessary to maintain and grow our business and operations; and (9) other risks and uncertainties detailed from time to time in the Company’s filings with the Securities and Exchange Commission (“SEC”). Potential investors, stockholders and other readers are cautioned not to place undue reliance on these forward-looking statements, which speak only as of the date on which they were made. TeraWulf does not assume any obligation to publicly update any forward-looking statement after it was made, whether as a result of new information, future events or otherwise, except as required by law or regulation. Investors are referred to the full discussion of risks and uncertainties associated with forward-looking statements and the discussion of risk factors contained in the Company’s filings with the SEC, which are available at www.sec.gov. This presentation contains references to certain non-GAAP financial measures, including “Adjusted EBITDA,“ “net debt” and "non-GAAP Segment Margin". For definitions of these terms and a detailed reconciliation between the non- GAAP financial results presented in this presentation and the corresponding GAAP measures, please refer to the Footnotes and Appendix in this presentation. In addition, this presentation includes a forward-looking non-GAAP financial measure, “net operating income” (“NOI”), which the Company defines as lease revenue for a specific lease less cost of revenue. Cost of revenue includes labor, insurance, property taxes, security, IT equipment , software and labor, and other costs directly related to the lease. Management uses NOI to assess the projected operating performance of individual leases. The most directly comparable GAAP measure is segment gross profit or loss. NOI has significant limitations as an analytical tool and should not be considered in isolation or as a substitute for GAAP results. In evaluating NOI, you should be aware that future non-reimbursable lease operating expenses may arise that are not currently known. The Company’s presentation of NOI should not be construed as an inference that its future results will be unaffected by unusual or non-recurring items. This measure excludes the impact of capital expenditures, material financial obligations, general and administrative expenses and depreciation and amortization, all of which have real economic effects and could materially affect the Company’s consolidated financial results. Definitions and calculations of NOI may vary among companies, and therefore the Company’s NOI may not be comparable to similar measures published by others. A reconciliation of NOI to segment gross profit or loss is not provided because NOI is only calculated for specific leases. Certain amounts cannot be reasonably estimated without unreasonable efforts because certain reconciling metrics are out of the Company’s control, and such estimates would imply a degree of precision that could be misleading to investors. 2
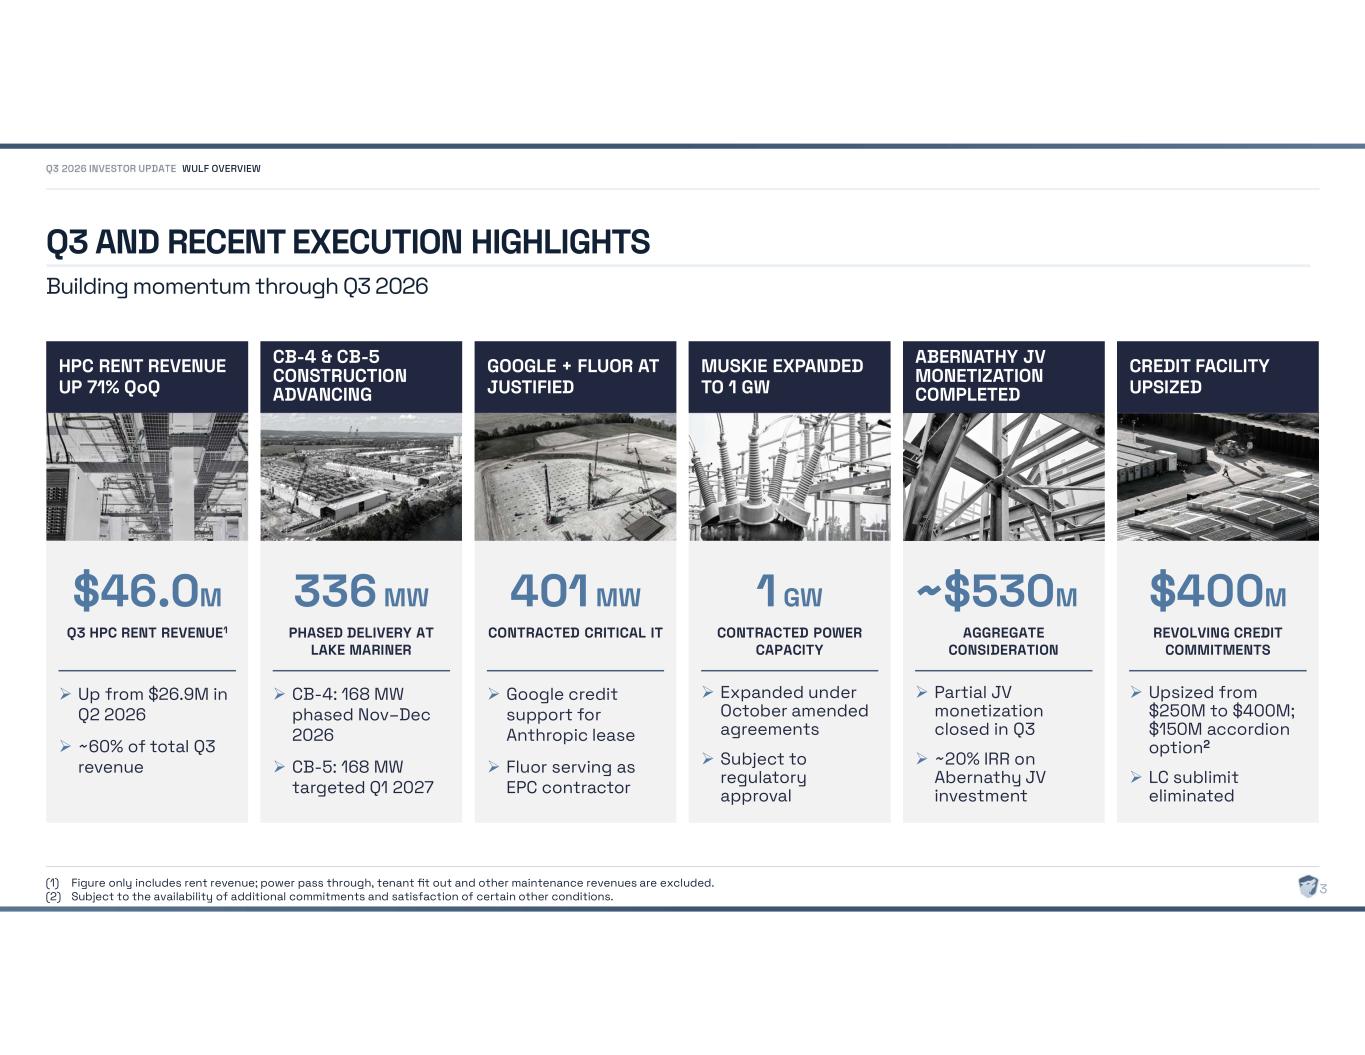
Q3 AND RECENT EXECUTION HIGHLIGHTS Building momentum through Q3 2026 WULF OVERVIEW 3 HPC RENT REVENUE UP 71% QoQ $46.0M Q3 HPC RENT REVENUE1 Up from $26.9M in Q2 2026 ~60% of total Q3 revenue ABERNATHY JV MONETIZATION COMPLETED ~$530M AGGREGATE CONSIDERATION Partial JV monetization closed in Q3 ~20% IRR on Abernathy JV investment GOOGLE + FLUOR AT JUSTIFIED 401 MW CONTRACTED CRITICAL IT Google credit support for Anthropic lease Fluor serving as EPC contractor CB-4 & CB-5 CONSTRUCTION ADVANCING 336 MW PHASED DELIVERY AT LAKE MARINER CB-4: 168 MW phased Nov–Dec 2026 CB-5: 168 MW targeted Q1 2027 MUSKIE EXPANDED TO 1 GW 1 GW CONTRACTED POWER CAPACITY Expanded under October amended agreements Subject to regulatory approval CREDIT FACILITY UPSIZED $400M REVOLVING CREDIT COMMITMENTS Upsized from $250M to $400M; $150M accordion option2 LC sublimit eliminated (1) Figure only includes rent revenue; power pass through, tenant fit out and other maintenance revenues are excluded. (2) Subject to the availability of additional commitments and satisfaction of certain other conditions.
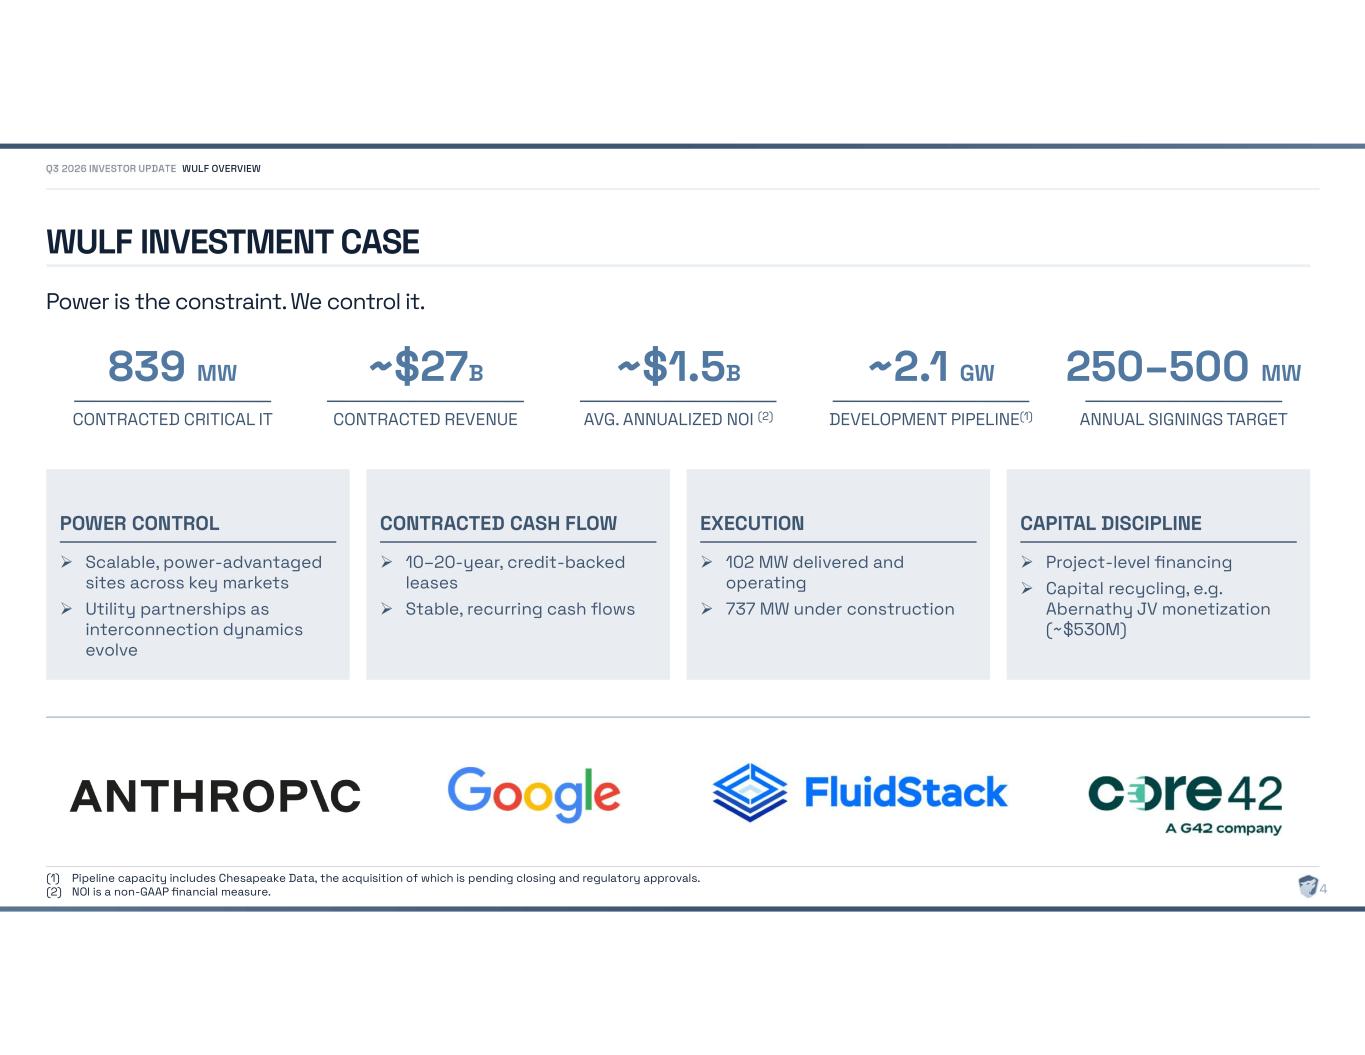
WULF INVESTMENT CASE Power is the constraint. We control it. WULF OVERVIEW 839 MW CONTRACTED CRITICAL IT ~$27B CONTRACTED REVENUE ~$1.5B AVG. ANNUALIZED NOI (2) ~2.1 GW DEVELOPMENT PIPELINE(1) 250–500 MW ANNUAL SIGNINGS TARGET POWER CONTROL Scalable, power-advantaged sites across key markets Utility partnerships as interconnection dynamics evolve CONTRACTED CASH FLOW 10–20-year, credit-backed leases Stable, recurring cash flows EXECUTION 102 MW delivered and operating 737 MW under construction CAPITAL DISCIPLINE Project-level financing Capital recycling, e.g. Abernathy JV monetization (~$530M) (1) Pipeline capacity includes Chesapeake Data, the acquisition of which is pending closing and regulatory approvals. (2) NOI is a non-GAAP financial measure. 4
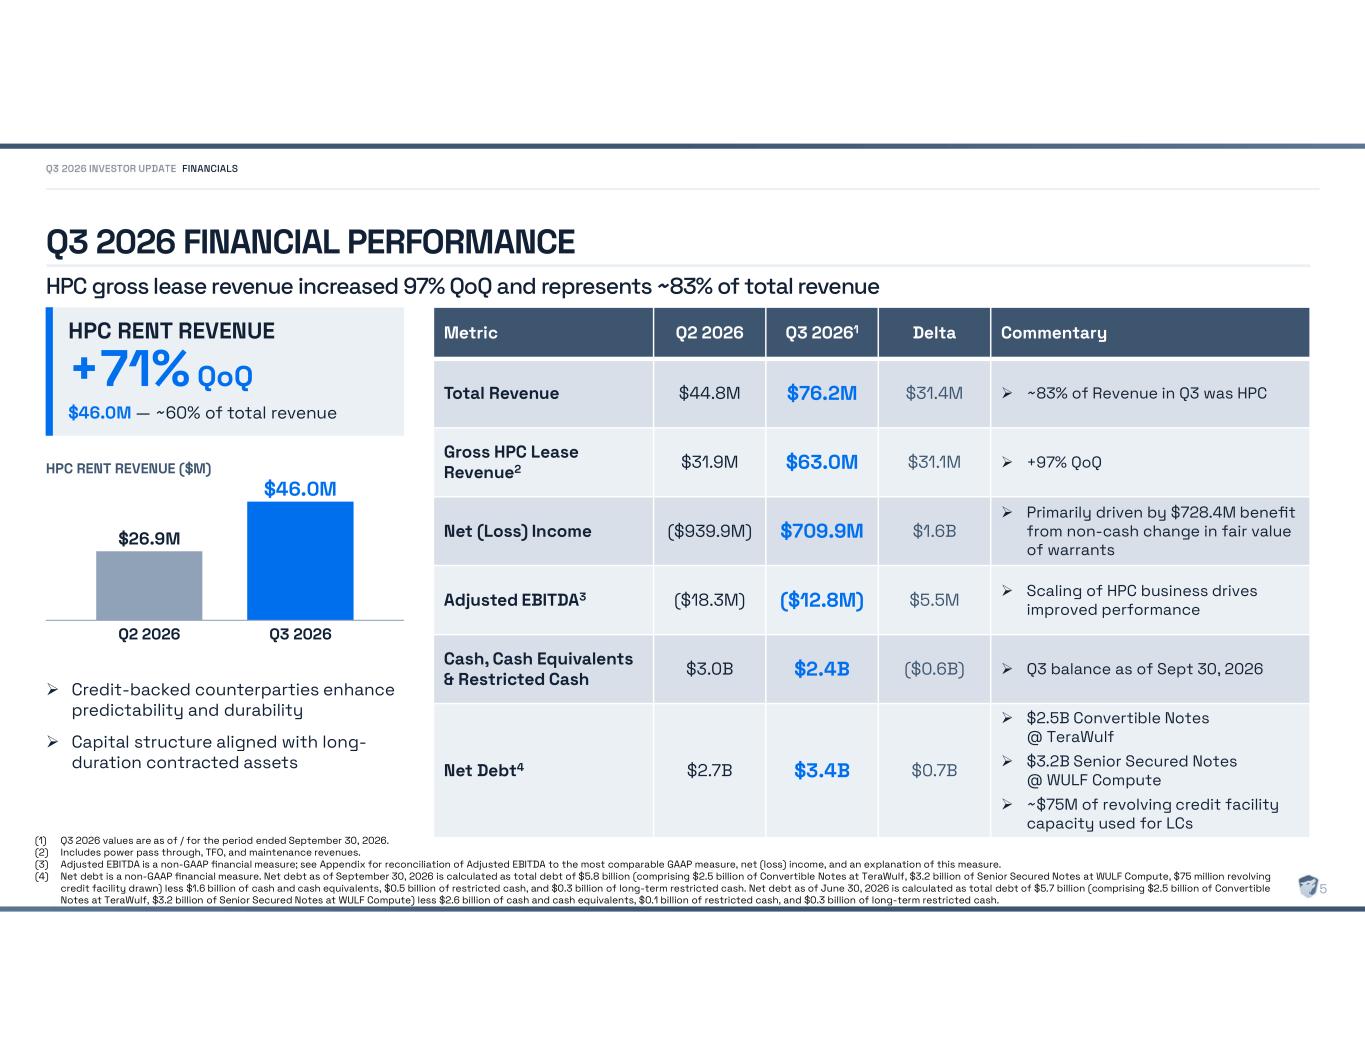
Q3 2026 FINANCIAL PERFORMANCE HPC gross lease revenue increased 97% QoQ and represents ~83% of total revenue Commentary Delta Q3 20261 Q2 2026 Metric ~83% of Revenue in Q3 was HPC $31.4M $76.2M $44.8M Total Revenue +97% QoQ $31.1M $63.0M $31.9M Gross HPC Lease Revenue2 Primarily driven by $728.4M benefit from non-cash change in fair value of warrants $1.6B $709.9M ($939.9M) Net (Loss) Income Scaling of HPC business drives improved performance $5.5M ($12.8M) ($18.3M) Adjusted EBITDA3 Q3 balance as of Sept 30, 2026 ($0.6B) $2.4B $3.0B Cash, Cash Equivalents & Restricted Cash $2.5B Convertible Notes @ TeraWulf $3.2B Senior Secured Notes @ WULF Compute ~$75M of revolving credit facility capacity used for LCs $0.7B $3.4B $2.7B Net Debt4 (1) Q3 2026 values are as of / for the period ended September 30, 2026. (2) Includes power pass through, TFO, and maintenance revenues. (3) Adjusted EBITDA is a non-GAAP financial measure; see Appendix for reconciliation of Adjusted EBITDA to the most comparable GAAP measure, net (loss) income, and an explanation of this measure. (4) Net debt is a non-GAAP financial measure. Net debt as of September 30, 2026 is calculated as total debt of $5.8 billion (comprising $2.5 billion of Convertible Notes at TeraWulf, $3.2 billion of Senior Secured Notes at WULF Compute, $75 million revolving credit facility drawn) less $1.6 billion of cash and cash equivalents, $0.5 billion of restricted cash, and $0.3 billion of long-term restricted cash. Net debt as of June 30, 2026 is calculated as total debt of $5.7 billion (comprising $2.5 billion of Convertible Notes at TeraWulf, $3.2 billion of Senior Secured Notes at WULF Compute) less $2.6 billion of cash and cash equivalents, $0.1 billion of restricted cash, and $0.3 billion of long-term restricted cash. HPC RENT REVENUE +71% QoQ $46.0M — ~60% of total revenue HPC RENT REVENUE ($M) $26.9M Q2 2026 $46.0M Q3 2026 Credit-backed counterparties enhance predictability and durability Capital structure aligned with long- duration contracted assets FINANCIALS 5
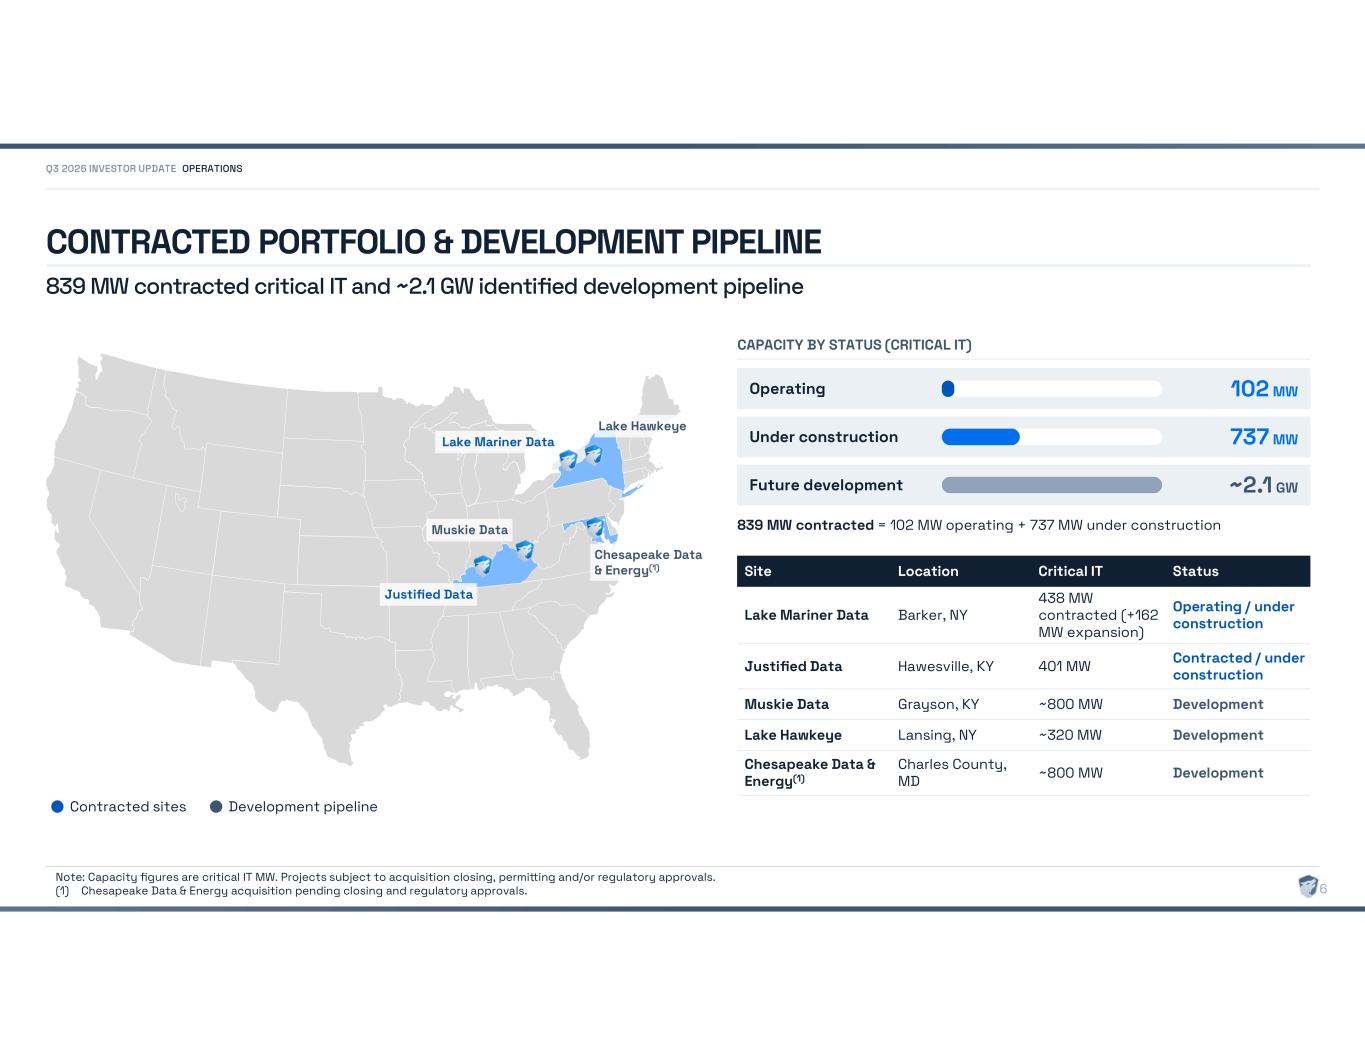
CONTRACTED PORTFOLIO & DEVELOPMENT PIPELINE 839 MW contracted critical IT and ~2.1 GW identified development pipeline OPERATIONS 6 Note: Capacity figures are critical IT MW. Projects subject to acquisition closing, permi ing and/or regulatory approvals. (1) Chesapeake Data & Energy acquisition pending closing and regulatory approvals. Lake Mariner Data Lake Hawkeye Chesapeake Data & Energy(1) Muskie Data Justified Data Contracted sites Development pipeline CAPACITY BY STATUS (CRITICAL IT) Operating 102 MW Under construction 737 MW Future development ~2.1 GW 839 MW contracted = 102 MW operating + 737 MW under construction Status Critical IT Location Site Operating / under construction 438 MW contracted (+162 MW expansion) Barker, NY Lake Mariner Data Contracted / under construction 401 MW Hawesville, KY Justified Data Development ~800 MW Grayson, KY Muskie Data Development ~320 MW Lansing, NY Lake Hawkeye Development ~800 MW Charles County, MD Chesapeake Data & Energy(1)
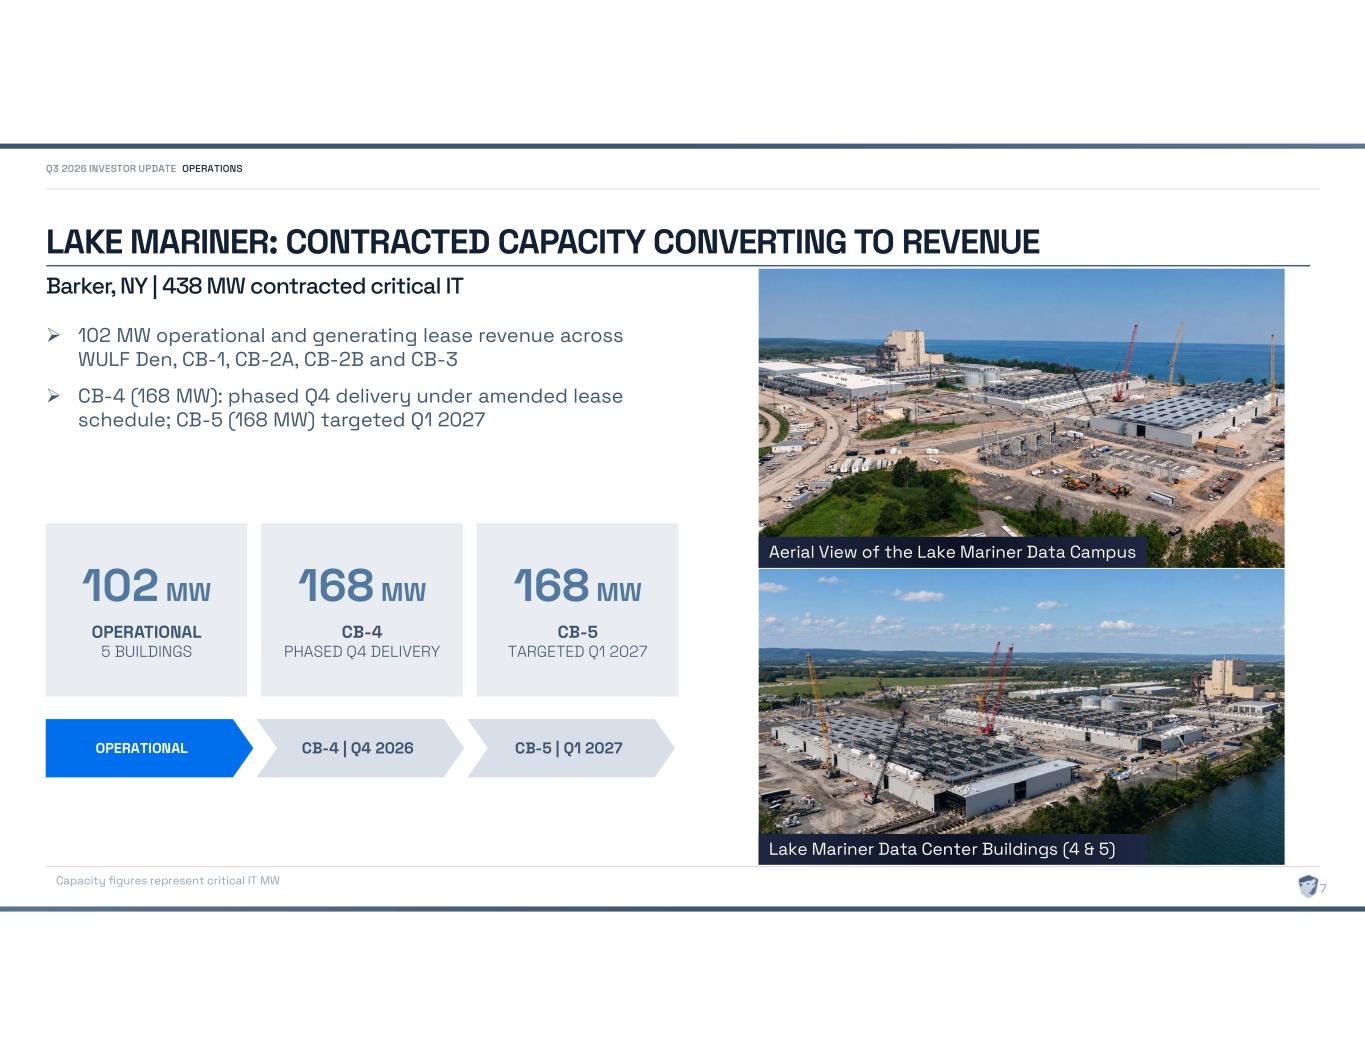
LAKE MARINER: CONTRACTED CAPACITY CONVERTING TO REVENUE Barker, NY | 438 MW contracted critical IT 102 MW operational and generating lease revenue across WULF Den, CB-1, CB-2A, CB-2B and CB-3 CB-4 (168 MW): phased Q4 delivery under amended lease schedule; CB-5 (168 MW) targeted Q1 2027 102 MW OPERATIONAL 5 BUILDINGS 168 MW CB-4 PHASED Q4 DELIVERY 168 MW CB-5 TARGETED Q1 2027 OPERATIONAL CB-4 | Q4 2026 CB-5 | Q1 2027 Capacity figures represent critical IT MW OPERATIONS 7 Lake Mariner Data Center Buildings (4 & 5) Aerial View of the Lake Mariner Data Campus
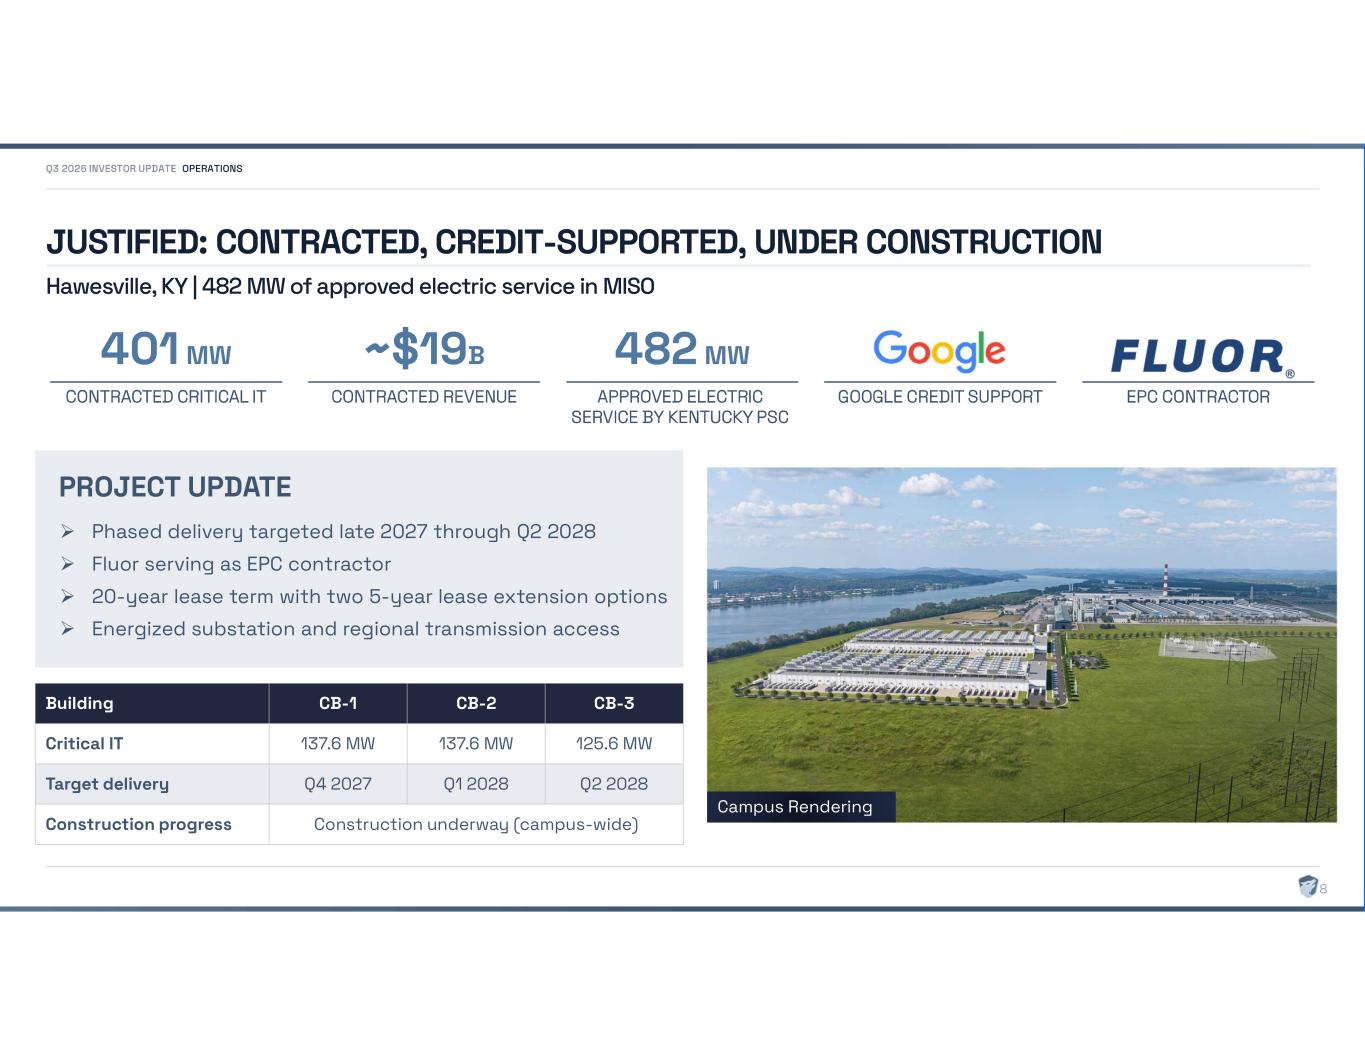
JUSTIFIED: CONTRACTED, CREDIT-SUPPORTED, UNDER CONSTRUCTION Hawesville, KY | 482 MW of approved electric service in MISO Phased delivery targeted late 2027 through Q2 2028 Fluor serving as EPC contractor 20-year lease term with two 5-year lease extension options Energized substation and regional transmission access PROJECT UPDATE OPERATIONS 8 401 MW CONTRACTED CRITICAL IT ~$19B CONTRACTED REVENUE 482 MW APPROVED ELECTRIC SERVICE BY KENTUCKY PSC GOOGLE CREDIT SUPPORT EPC CONTRACTOR CB-3 CB-2 CB-1 Building 125.6 MW 137.6 MW 137.6 MW Critical IT Q2 2028 Q1 2028 Q4 2027 Target delivery Construction underway (campus-wide) Construction progress Campus Rendering
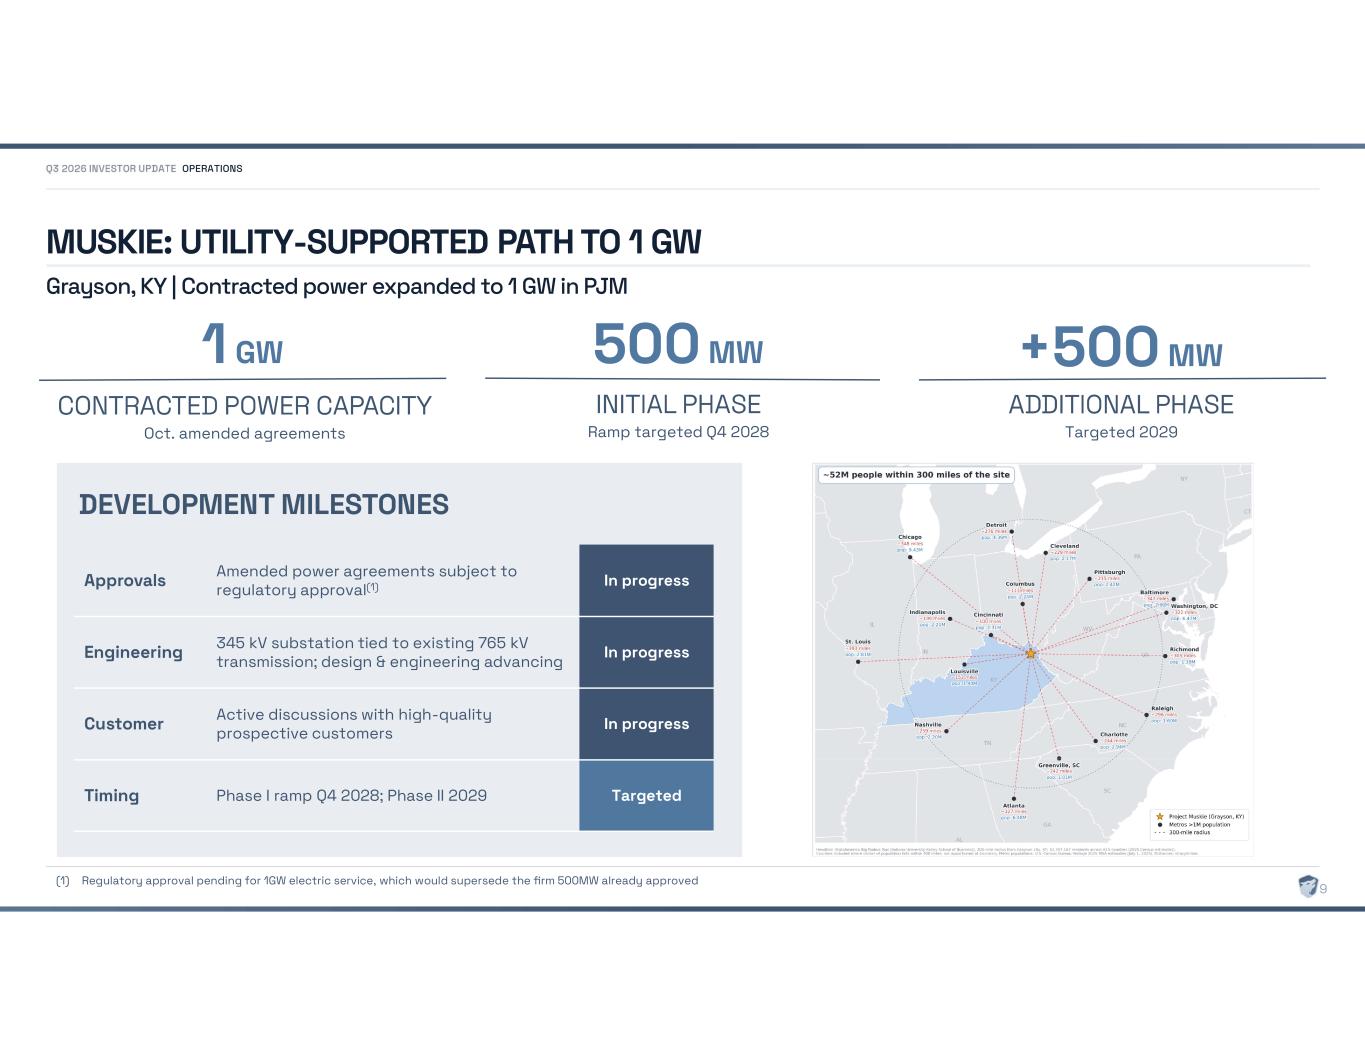
MUSKIE: UTILITY-SUPPORTED PATH TO 1 GW Grayson, KY | Contracted power expanded to 1 GW in PJM In progress Amended power agreements subject to regulatory approval(1) Approvals In progress 345 kV substation tied to existing 765 kV transmission; design & engineering advancing Engineering In progress Active discussions with high-quality prospective customers Customer Targeted Phase I ramp Q4 2028; Phase II 2029 Timing DEVELOPMENT MILESTONES 1 GW CONTRACTED POWER CAPACITY Oct. amended agreements 500 MW INITIAL PHASE Ramp targeted Q4 2028 +500 MW ADDITIONAL PHASE Targeted 2029 OPERATIONS 9 (1) Regulatory approval pending for 1GW electric service, which would supersede the firm 500MW already approved
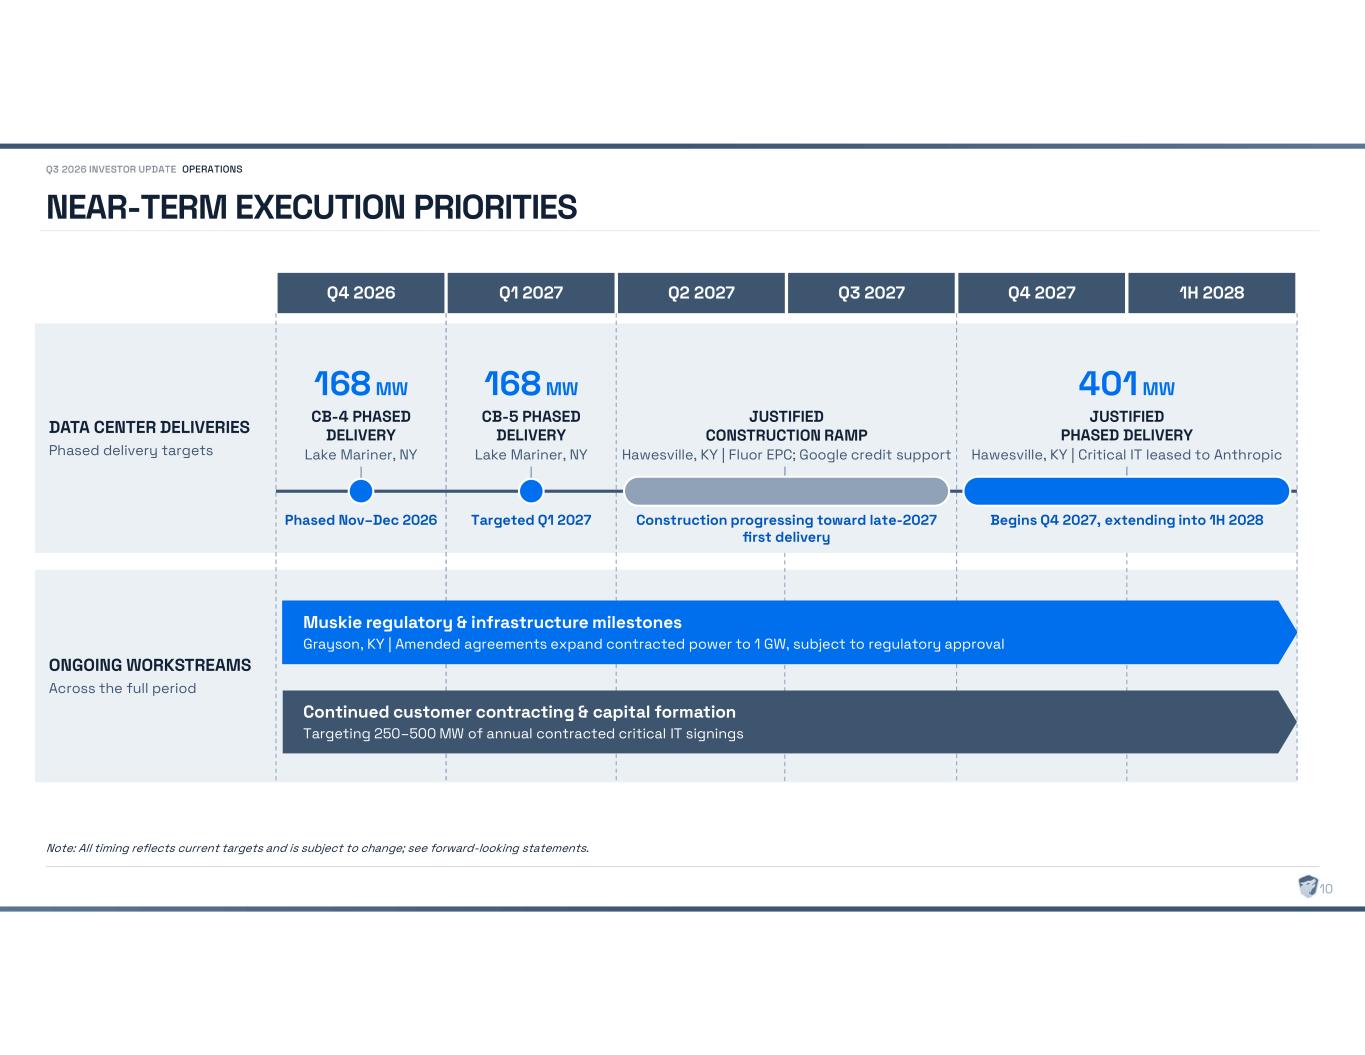
NEAR-TERM EXECUTION PRIORITIES Note: All timing reflects current targets and is subject to change; see forward-looking statements. 10 Q4 2026 Q1 2027 Q2 2027 Q3 2027 Q4 2027 1H 2028 DATA CENTER DELIVERIES Phased delivery targets ONGOING WORKSTREAMS Across the full period 168 MW CB-4 PHASED DELIVERY Lake Mariner, NY Phased Nov–Dec 2026 168 MW CB-5 PHASED DELIVERY Lake Mariner, NY Targeted Q1 2027 401 MW JUSTIFIED PHASED DELIVERY Hawesville, KY | Critical IT leased to Anthropic Begins Q4 2027, extending into 1H 2028 JUSTIFIED CONSTRUCTION RAMP Hawesville, KY | Fluor EPC; Google credit support Construction progressing toward late-2027 first delivery Continued customer contracting & capital formation Targeting 250–500 MW of annual contracted critical IT signings Muskie regulatory & infrastructure milestones Grayson, KY | Amended agreements expand contracted power to 1 GW, subject to regulatory approval OPERATIONS
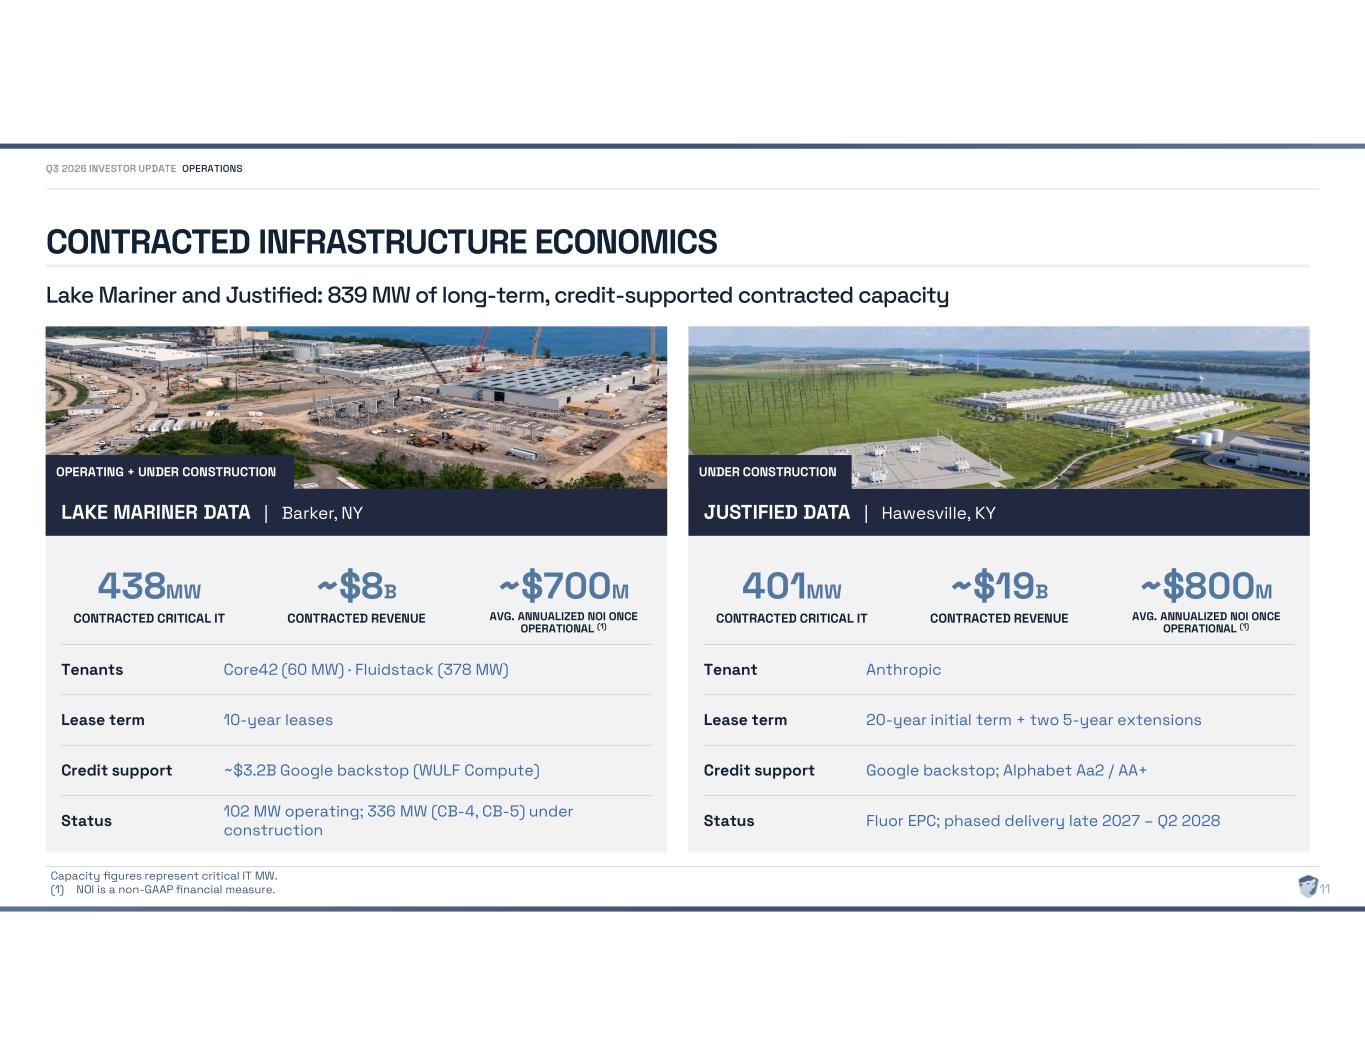
CONTRACTED INFRASTRUCTURE ECONOMICS Lake Mariner and Justified: 839 MW of long-term, credit-supported contracted capacity Capacity figures represent critical IT MW. (1) NOI is a non-GAAP financial measure. OPERATING + UNDER CONSTRUCTION LAKE MARINER DATA | Barker, NY 438MW CONTRACTED CRITICAL IT ~$8B CONTRACTED REVENUE ~$700M AVG. ANNUALIZED NOI ONCE OPERATIONAL (1) Tenants Core42 (60 MW) · Fluidstack (378 MW) Lease term 10-year leases Credit support ~$3.2B Google backstop (WULF Compute) Status 102 MW operating; 336 MW (CB-4, CB-5) under construction UNDER CONSTRUCTION JUSTIFIED DATA | Hawesville, KY 401MW CONTRACTED CRITICAL IT ~$19B CONTRACTED REVENUE ~$800M AVG. ANNUALIZED NOI ONCE OPERATIONAL (1) Tenant Anthropic Lease term 20-year initial term + two 5-year extensions Credit support Google backstop; Alphabet Aa2 / AA+ Status Fluor EPC; phased delivery late 2027 – Q2 2028 OPERATIONS 11
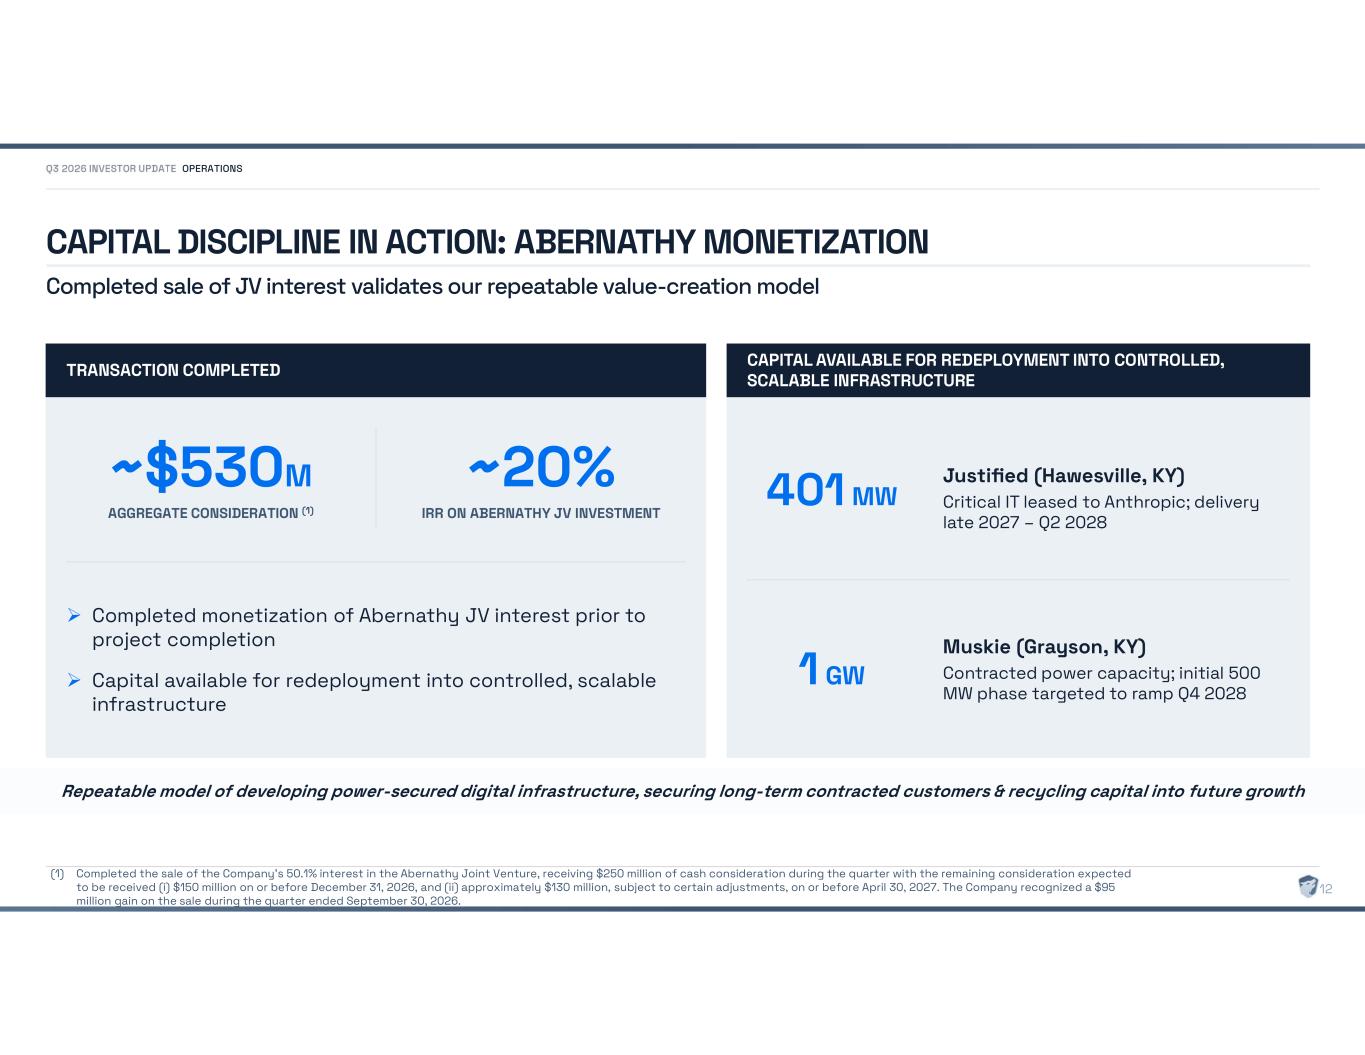
CAPITAL DISCIPLINE IN ACTION: ABERNATHY MONETIZATION Completed sale of JV interest validates our repeatable value-creation model OPERATIONS TRANSACTION COMPLETED ~$530M AGGREGATE CONSIDERATION (1) ~20% IRR ON ABERNATHY JV INVESTMENT Completed monetization of Abernathy JV interest prior to project completion Capital available for redeployment into controlled, scalable infrastructure CAPITAL AVAILABLE FOR REDEPLOYMENT INTO CONTROLLED, SCALABLE INFRASTRUCTURE 401 MW Justified (Hawesville, KY) Critical IT leased to Anthropic; delivery late 2027 – Q2 2028 1 GW Muskie (Grayson, KY) Contracted power capacity; initial 500 MW phase targeted to ramp Q4 2028 Repeatable model of developing power-secured digital infrastructure, securing long-term contracted customers & recycling capital into future growth 12 (1) Completed the sale of the Company’s 50.1% interest in the Abernathy Joint Venture, receiving $250 million of cash consideration during the quarter with the remaining consideration expected to be received (i) $150 million on or before December 31, 2026, and (ii) approximately $130 million, subject to certain adjustments, on or before April 30, 2027. The Company recognized a $95 million gain on the sale during the quarter ended September 30, 2026.
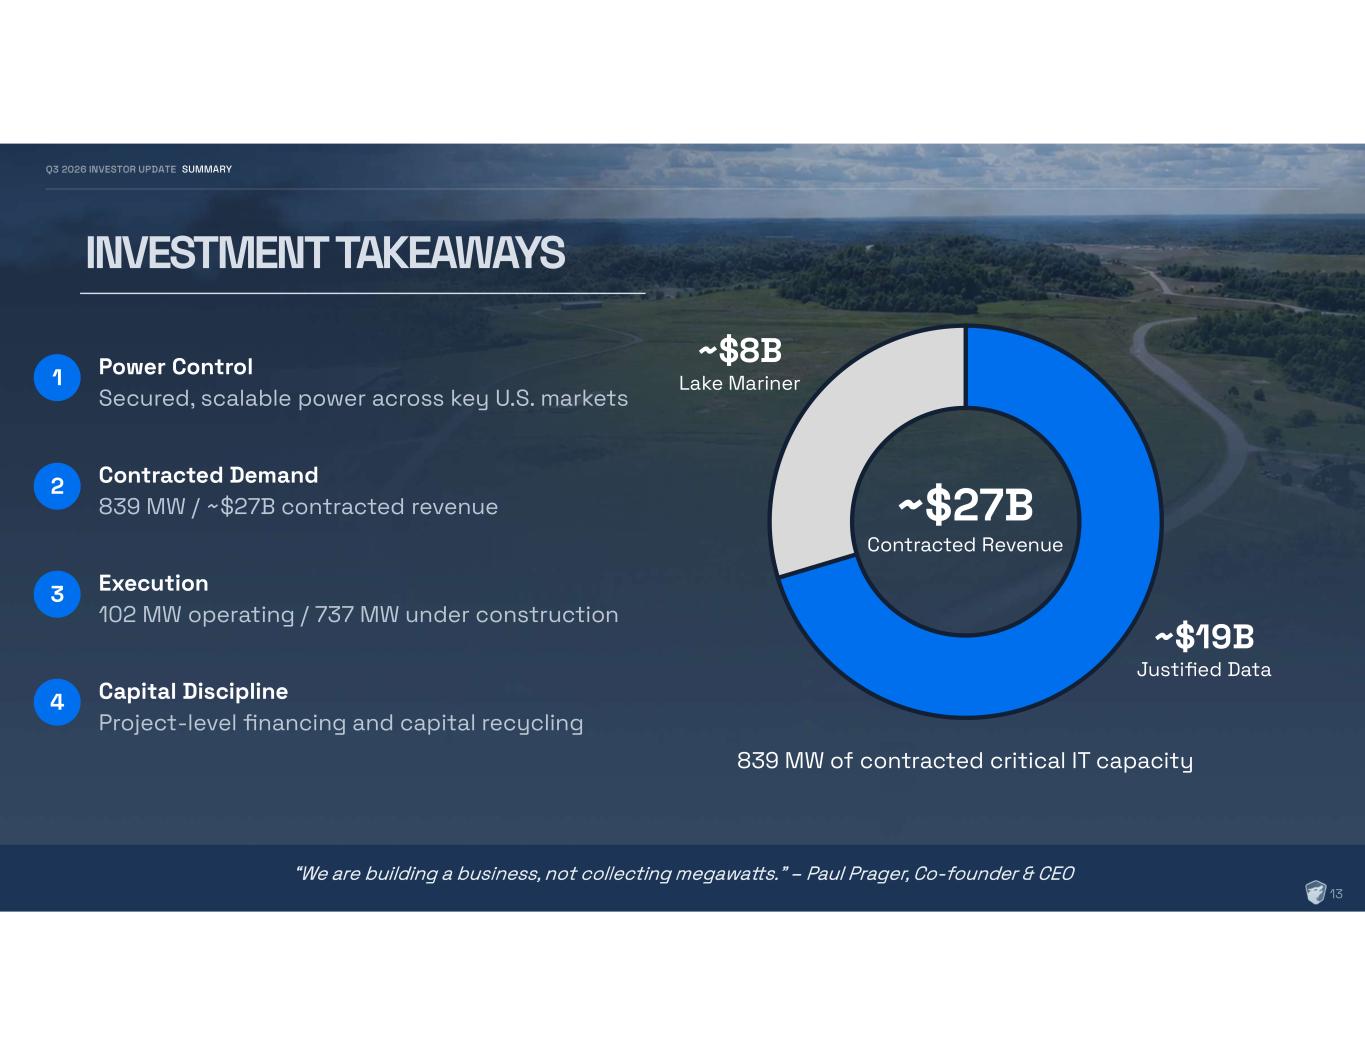
1 Power Control Secured, scalable power across key U.S. markets 2 Contracted Demand 839 MW / ~$27B contracted revenue 3 Execution 102 MW operating / 737 MW under construction 4 Capital Discipline Project-level financing and capital recycling INVESTMENT TAKEAWAYS “We are building a business, not collecting megawa s.” – Paul Prager, Co-founder & CEO 13 SUMMARY ~$27B Contracted Revenue 839 MW of contracted critical IT capacity ~$19B Justified Data ~$8B Lake Mariner
14 APPENDIX
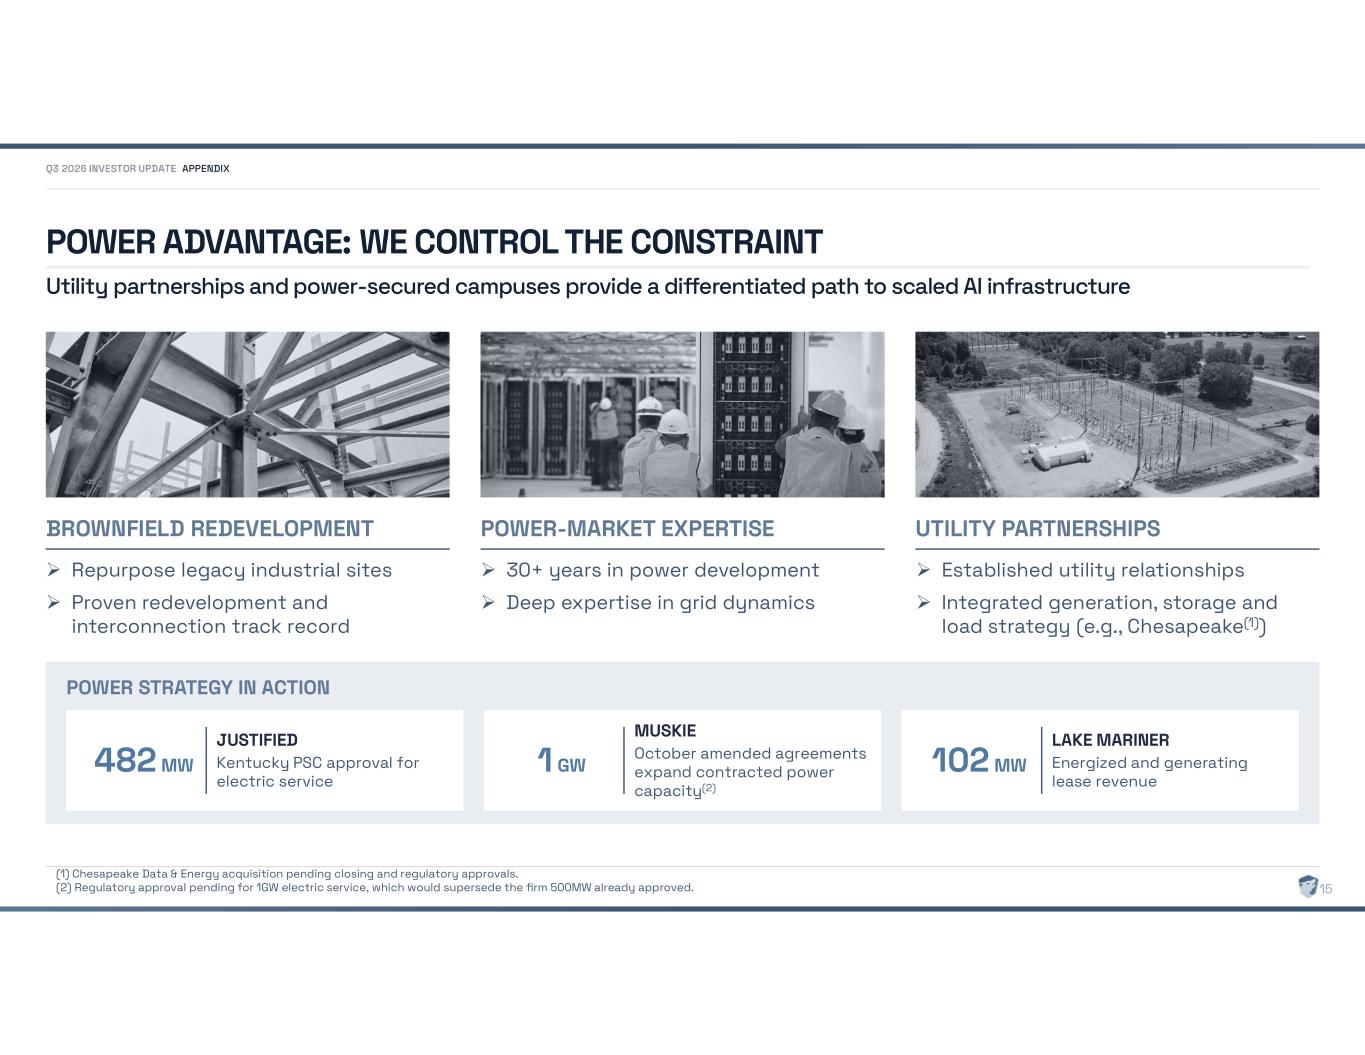
POWER ADVANTAGE: WE CONTROL THE CONSTRAINT BROWNFIELD REDEVELOPMENT Repurpose legacy industrial sites Proven redevelopment and interconnection track record POWER-MARKET EXPERTISE 30+ years in power development Deep expertise in grid dynamics UTILITY PARTNERSHIPS Established utility relationships Integrated generation, storage and load strategy (e.g., Chesapeake(1)) POWER STRATEGY IN ACTION JUSTIFIED Kentucky PSC approval for electric service 482 MW MUSKIE October amended agreements expand contracted power capacity(2) 1 GW LAKE MARINER Energized and generating lease revenue 102 MW APPENDIX 15 (1) Chesapeake Data & Energy acquisition pending closing and regulatory approvals. (2) Regulatory approval pending for 1GW electric service, which would supersede the firm 500MW already approved. Utility partnerships and power-secured campuses provide a differentiated path to scaled AI infrastructure
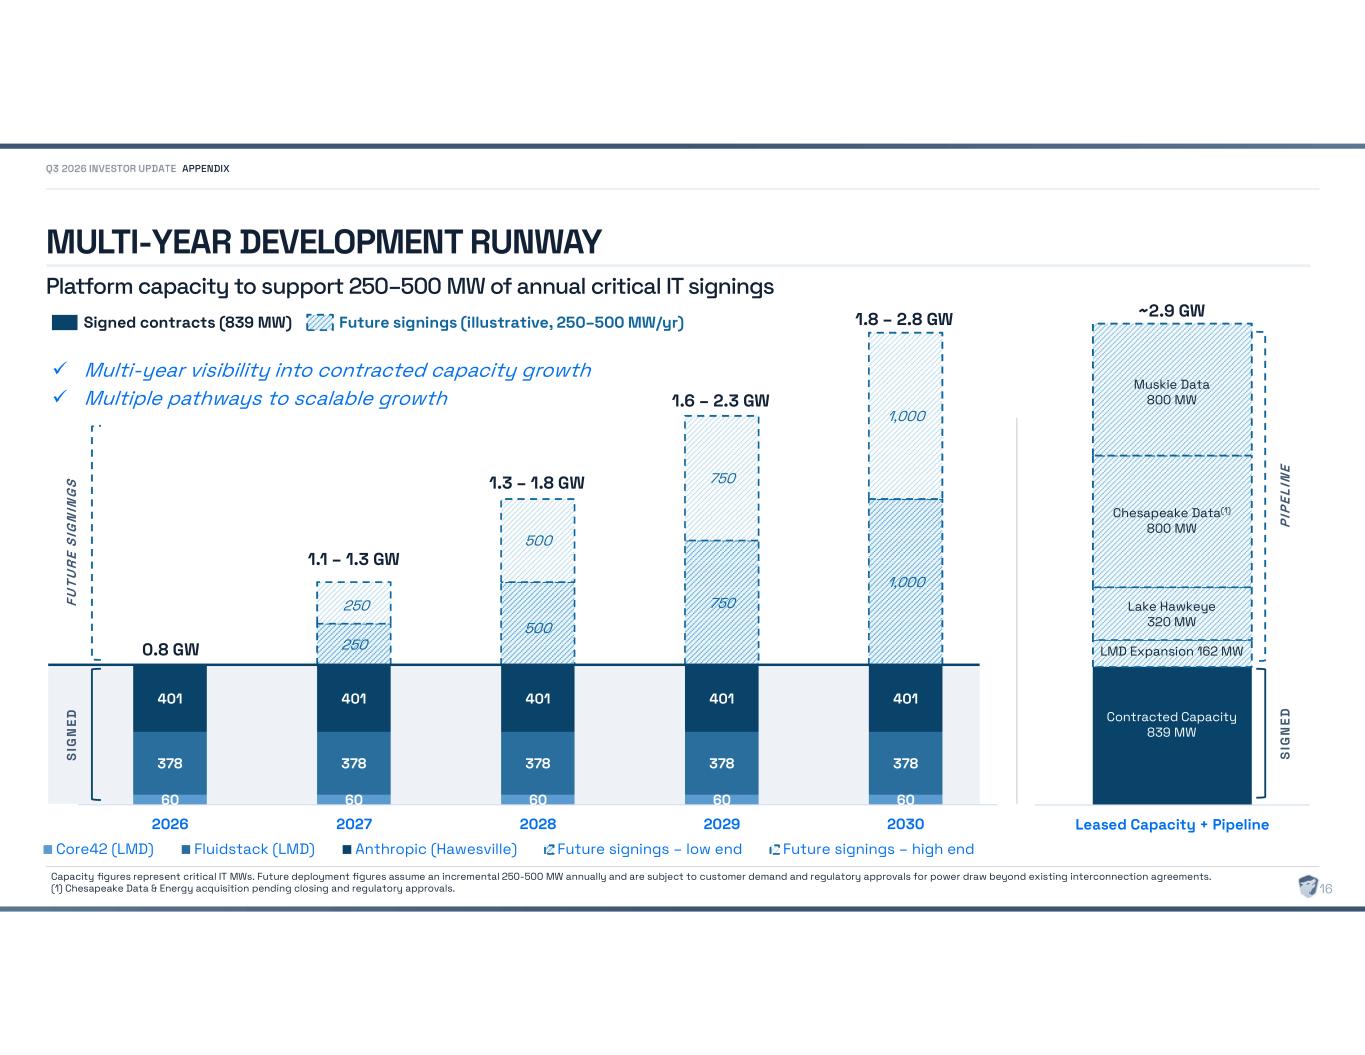
MULTI-YEAR DEVELOPMENT RUNWAY Platform capacity to support 250–500 MW of annual critical IT signings APPENDIX 60 60 60 60 60 378 378 378 378 378 401 401 401 401 401 250 500 750 1,000 250 500 750 1,000 2026 2027 2028 2029 2030 Core42 (LMD) Fluidstack (LMD) Anthropic (Hawesville) Future signings – low end Future signings – high end 1.1 – 1.3 GW 1.3 – 1.8 GW 1.6 – 2.3 GW 0.8 GW 1.8 – 2.8 GW Multi-year visibility into contracted capacity growth Multiple pathways to scalable growth Leased Capacity + Pipeline Contracted Capacity 839 MW LMD Expansion 162 MW Lake Hawkeye 320 MW Chesapeake Data(1) 800 MW Muskie Data 800 MW ~2.9 GW Capacity figures represent critical IT MWs. Future deployment figures assume an incremental 250-500 MW annually and are subject to customer demand and regulatory approvals for power draw beyond existing interconnection agreements. (1) Chesapeake Data & Energy acquisition pending closing and regulatory approvals. 16 Signed contracts (839 MW) Future signings (illustrative, 250–500 MW/yr) S IG N E D FU T U R E S IG N IN G S S IG N E D P IP EL IN E
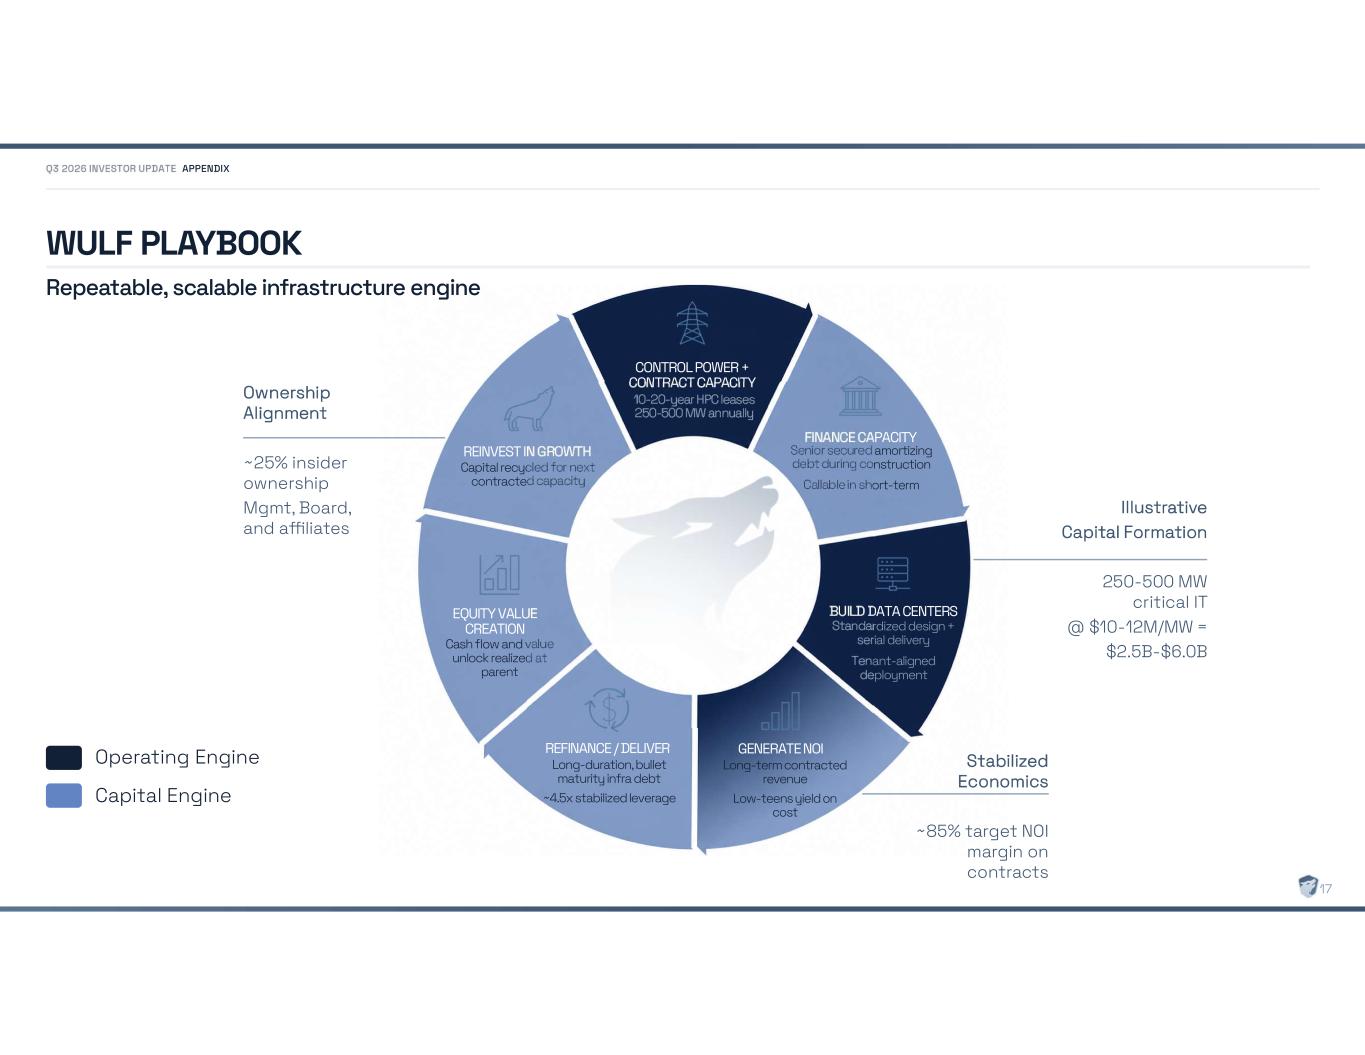
WULF PLAYBOOK Repeatable, scalable infrastructure engine CONTROL POWER + CONTRACT CAPACITY 10-20-year HPC leases 250-500 MW annually BUILD DATA CENTERS Standardized design + serial delivery Tenant-aligned deployment GENERATE NOI Long-term contracted revenue Low-teens yield on cost FINANCE CAPACITY Senior secured amortizing debt during construction Callable in short-term REFINANCE / DELIVER Long-duration, bullet maturity infra debt ~4.5x stabilized leverage REINVEST IN GROWTH Capital recycled for next contracted capacity EQUITY VALUE CREATION Cash flow and value unlock realized at parent Ownership Alignment ~25% insider ownership Mgmt, Board, and affiliates Operating Engine Capital Engine Illustrative Capital Formation 250-500 MW critical IT @ $10-12M/MW = $2.5B-$6.0B Stabilized Economics ~85% target NOI margin on contracts APPENDIX 17
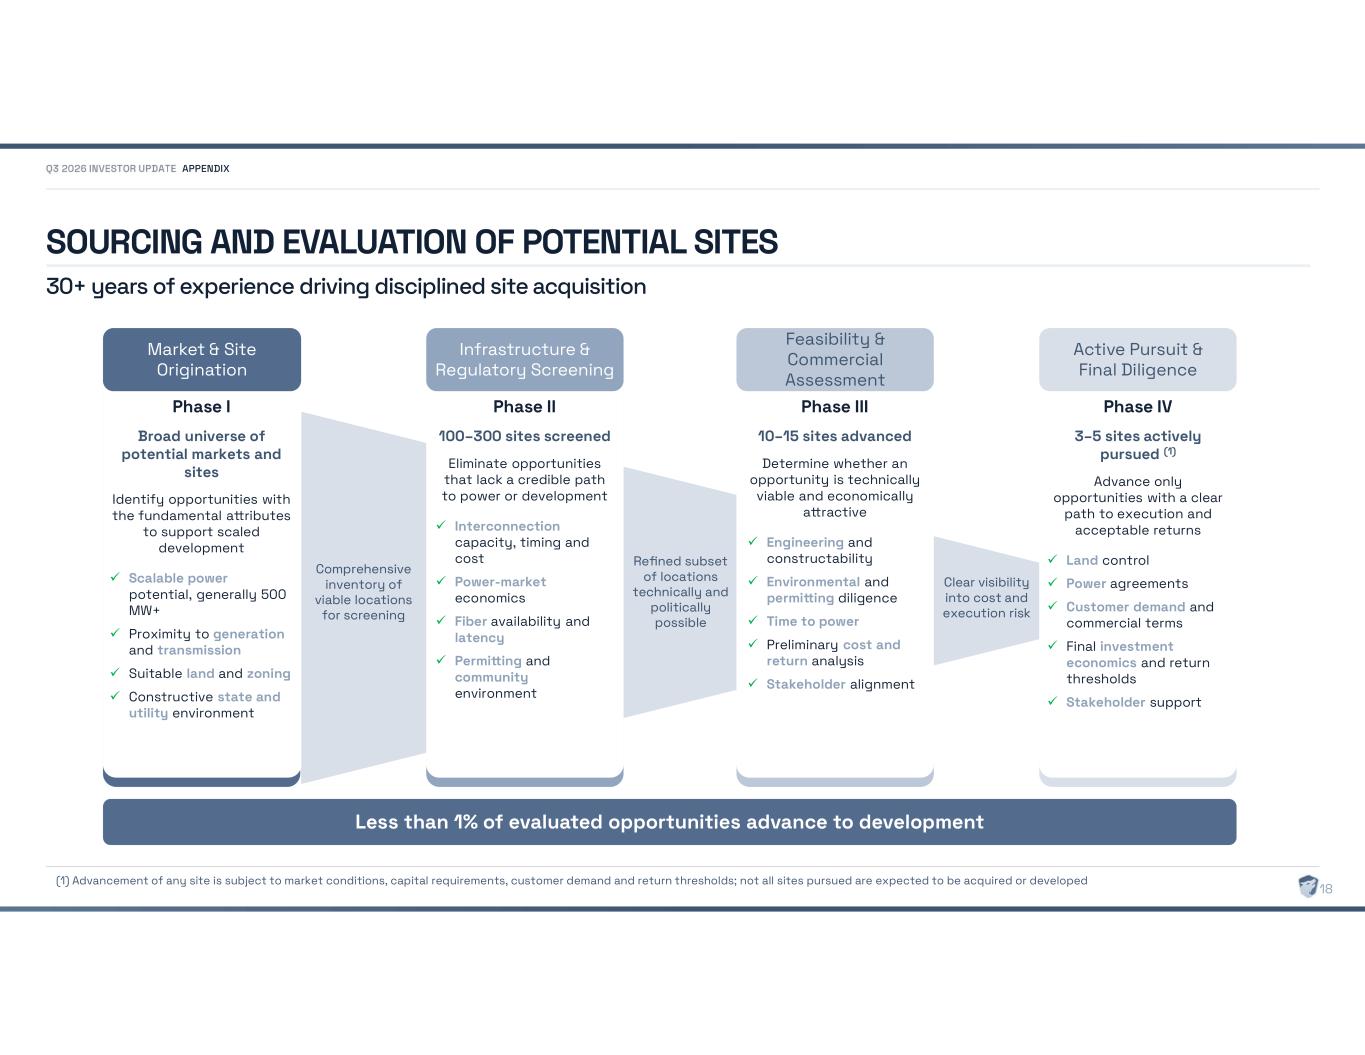
30+ years of experience driving disciplined site acquisition SOURCING AND EVALUATION OF POTENTIAL SITES Broad Universe of Potential Sites Broad Universe of Potential Sites Broad Universe of Potential Sites Broad Universe of Potential Sites Market & Site Origination Infrastructure & Regulatory Screening Feasibility & Commercial Assessment Active Pursuit & Final Diligence Phase I Broad universe of potential markets and sites Identify opportunities with the fundamental a ributes to support scaled development Scalable power potential, generally 500 MW+ Proximity to generation and transmission Suitable land and zoning Constructive state and utility environment Phase II 100–300 sites screened Eliminate opportunities that lack a credible path to power or development Interconnection capacity, timing and cost Power-market economics Fiber availability and latency Permi ing and community environment Phase III 10–15 sites advanced Determine whether an opportunity is technically viable and economically a ractive Engineering and constructability Environmental and permi ing diligence Time to power Preliminary cost and return analysis Stakeholder alignment Phase IV 3–5 sites actively pursued (1) Advance only opportunities with a clear path to execution and acceptable returns Land control Power agreements Customer demand and commercial terms Final investment economics and return thresholds Stakeholder support Refined subset of locations technically and politically possible Comprehensive inventory of viable locations for screening Clear visibility into cost and execution risk APPENDIX 18 (1) Advancement of any site is subject to market conditions, capital requirements, customer demand and return thresholds; not all sites pursued are expected to be acquired or developed Less than 1% of evaluated opportunities advance to development
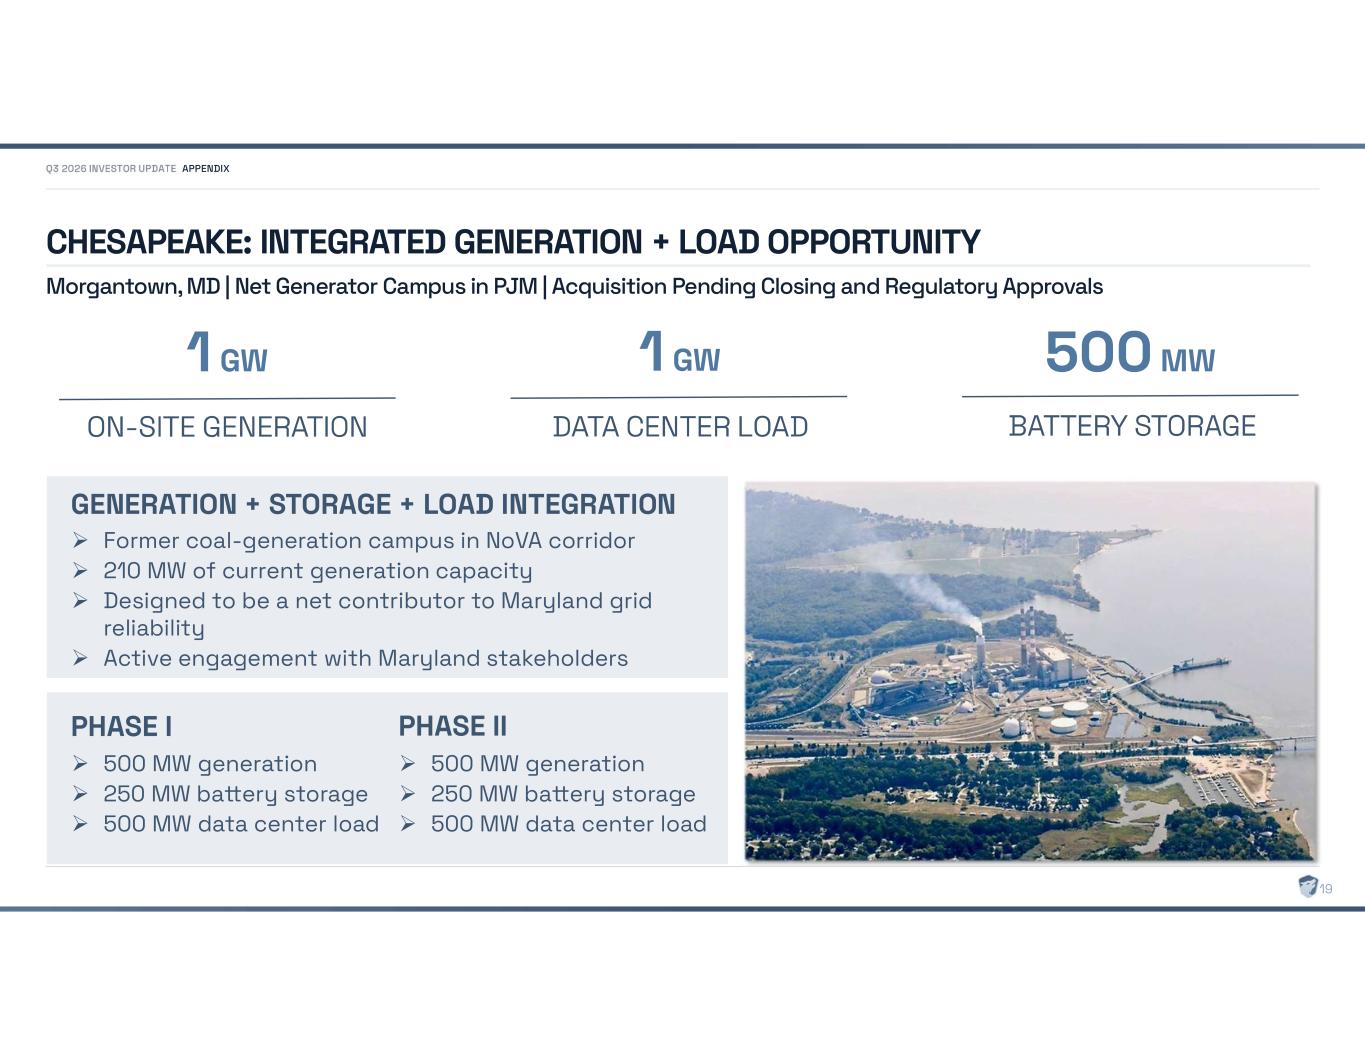
CHESAPEAKE: INTEGRATED GENERATION + LOAD OPPORTUNITY Morgantown, MD | Net Generator Campus in PJM | Acquisition Pending Closing and Regulatory Approvals 500 MW generation 250 MW ba ery storage 500 MW data center load PHASE I Former coal-generation campus in NoVA corridor 210 MW of current generation capacity Designed to be a net contributor to Maryland grid reliability Active engagement with Maryland stakeholders GENERATION + STORAGE + LOAD INTEGRATION 1 GW ON-SITE GENERATION 1 GW DATA CENTER LOAD 500 MW BATTERY STORAGE 500 MW generation 250 MW ba ery storage 500 MW data center load PHASE II APPENDIX 19
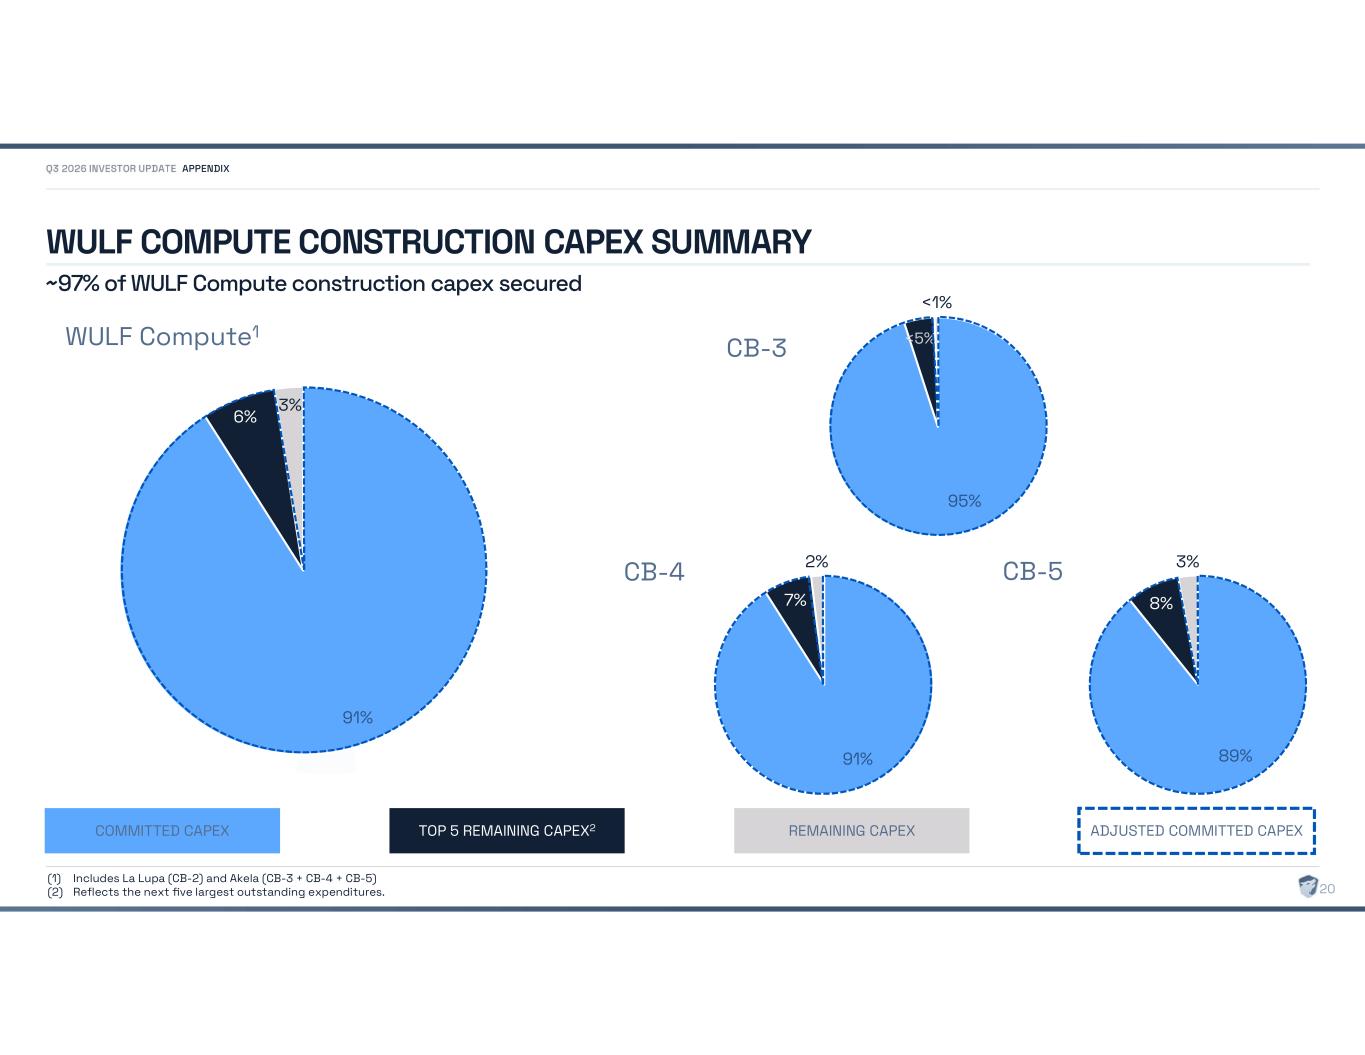
95% <5% <1% WULF COMPUTE CONSTRUCTION CAPEX SUMMARY COMMITTED CAPEX TOP 5 REMAINING CAPEX2 REMAINING CAPEX ADJUSTED COMMITTED CAPEX WULF Compute1 CB-3 CB-4 CB-5 (1) Includes La Lupa (CB-2) and Akela (CB-3 + CB-4 + CB-5) (2) Reflects the next five largest outstanding expenditures. APPENDIX ~97% of WULF Compute construction capex secured 91% 6% 3% 91% 7% 2% 89% 8% 3% 20
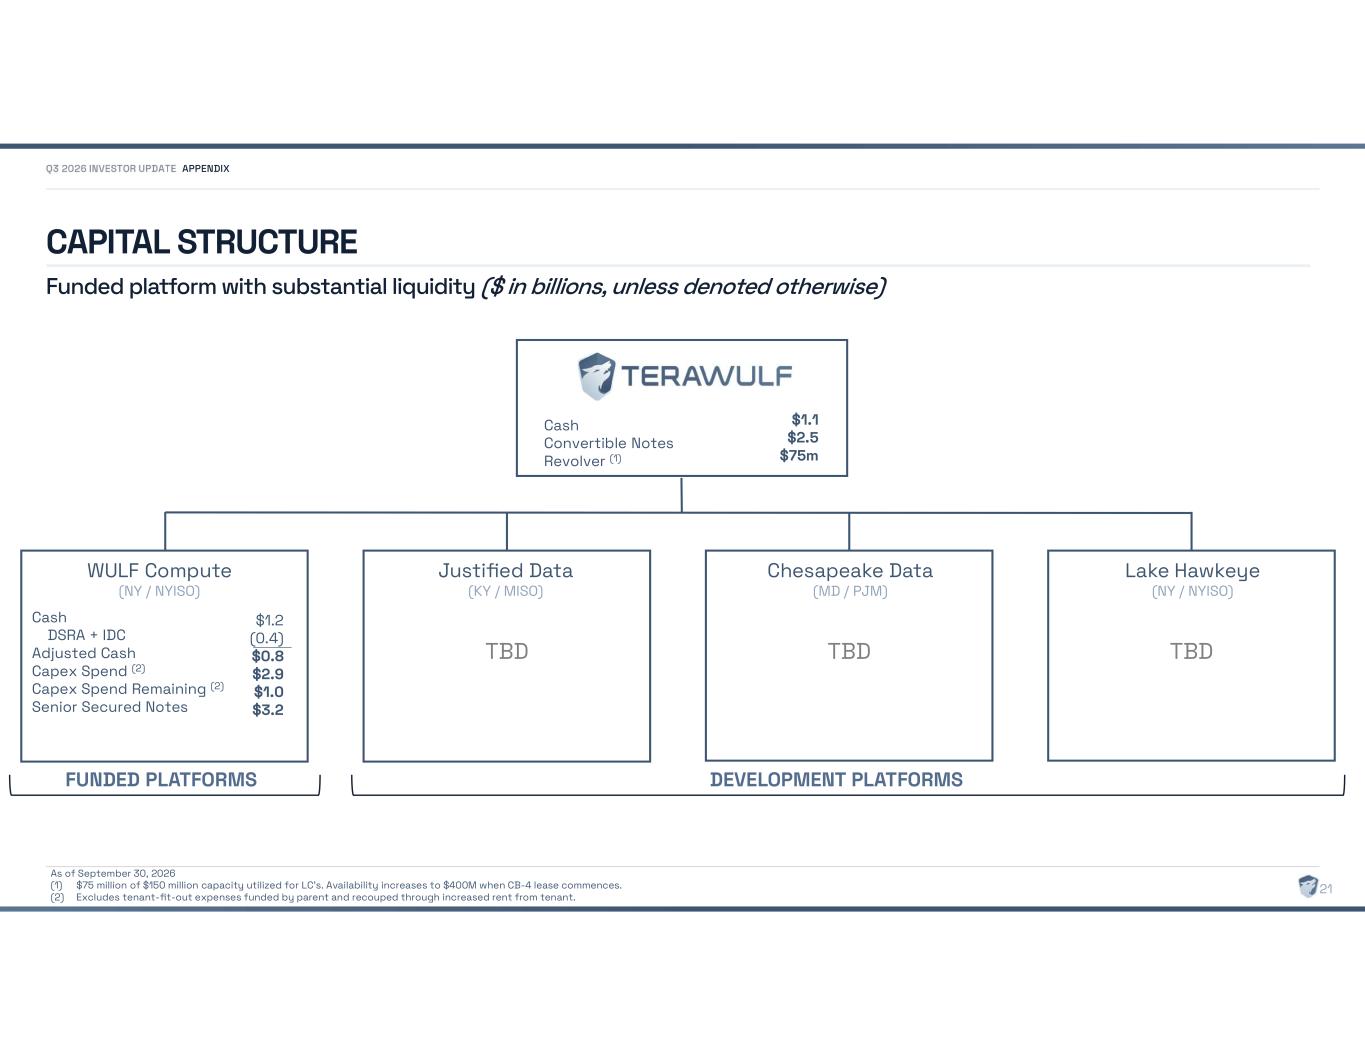
CAPITAL STRUCTURE Funded platform with substantial liquidity ($ in billions, unless denoted otherwise) As of September 30, 2026 (1) $75 million of $150 million capacity utilized for LC’s. Availability increases to $400M when CB-4 lease commences. (2) Excludes tenant-fit-out expenses funded by parent and recouped through increased rent from tenant. Cash Convertible Notes Revolver (1) $1.1 $2.5 $75m WULF Compute (NY / NYISO) Cash DSRA + IDC Adjusted Cash Capex Spend (2) Capex Spend Remaining (2) Senior Secured Notes $1.2 (0.4) $0.8 $2.9 $1.0 $3.2 $1,479 (100) (225 TBD $268 $1,087 $1,300 Chesapeake Data (MD / PJM) $1,479 (100) (225) TBD $268 $1,087 $1,300 Lake Hawkeye (NY / NYISO) FUNDED PLATFORMS APPENDIX 21 TBD Justified Data (KY / MISO) DEVELOPMENT PLATFORMS
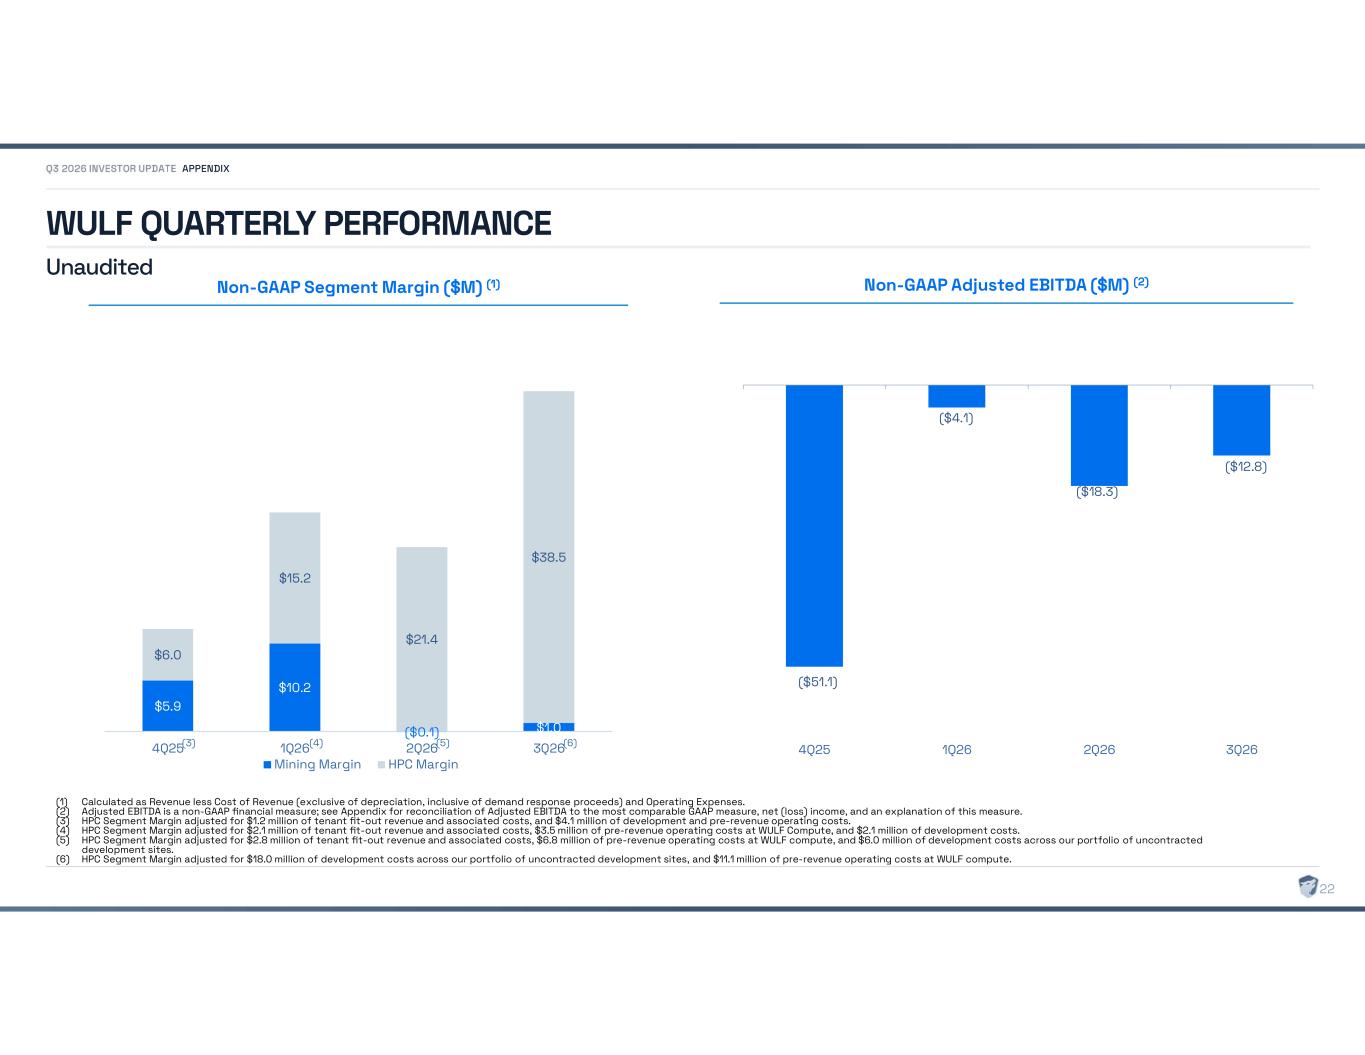
$5.9 $10.2 ($0.1) $1.0 $6.0 $15.2 $21.4 $38.5 4Q25 1Q26 2Q26 3Q26 Mining Margin HPC Margin WULF QUARTERLY PERFORMANCE Non-GAAP Segment Margin ($M) (1) ($51.1) ($4.1) ($18.3) ($12.8) 4Q25 1Q26 2Q26 3Q26 Non-GAAP Adjusted EBITDA ($M) (2) (1) Calculated as Revenue less Cost of Revenue (exclusive of depreciation, inclusive of demand response proceeds) and Operating Expenses. (2) Adjusted EBITDA is a non-GAAP financial measure; see Appendix for reconciliation of Adjusted EBITDA to the most comparable GAAP measure, net (loss) income, and an explanation of this measure. (3) HPC Segment Margin adjusted for $1.2 million of tenant fit-out revenue and associated costs, and $4.1 million of development and pre-revenue operating costs. (4) HPC Segment Margin adjusted for $2.1 million of tenant fit-out revenue and associated costs, $3.5 million of pre-revenue operating costs at WULF Compute, and $2.1 million of development costs. (5) HPC Segment Margin adjusted for $2.8 million of tenant fit-out revenue and associated costs, $6.8 million of pre-revenue operating costs at WULF compute, and $6.0 million of development costs across our portfolio of uncontracted development sites. (6) HPC Segment Margin adjusted for $18.0 million of development costs across our portfolio of uncontracted development sites, and $11.1 million of pre-revenue operating costs at WULF compute. (3) (4) APPENDIX 22 Unaudited (5) (6)
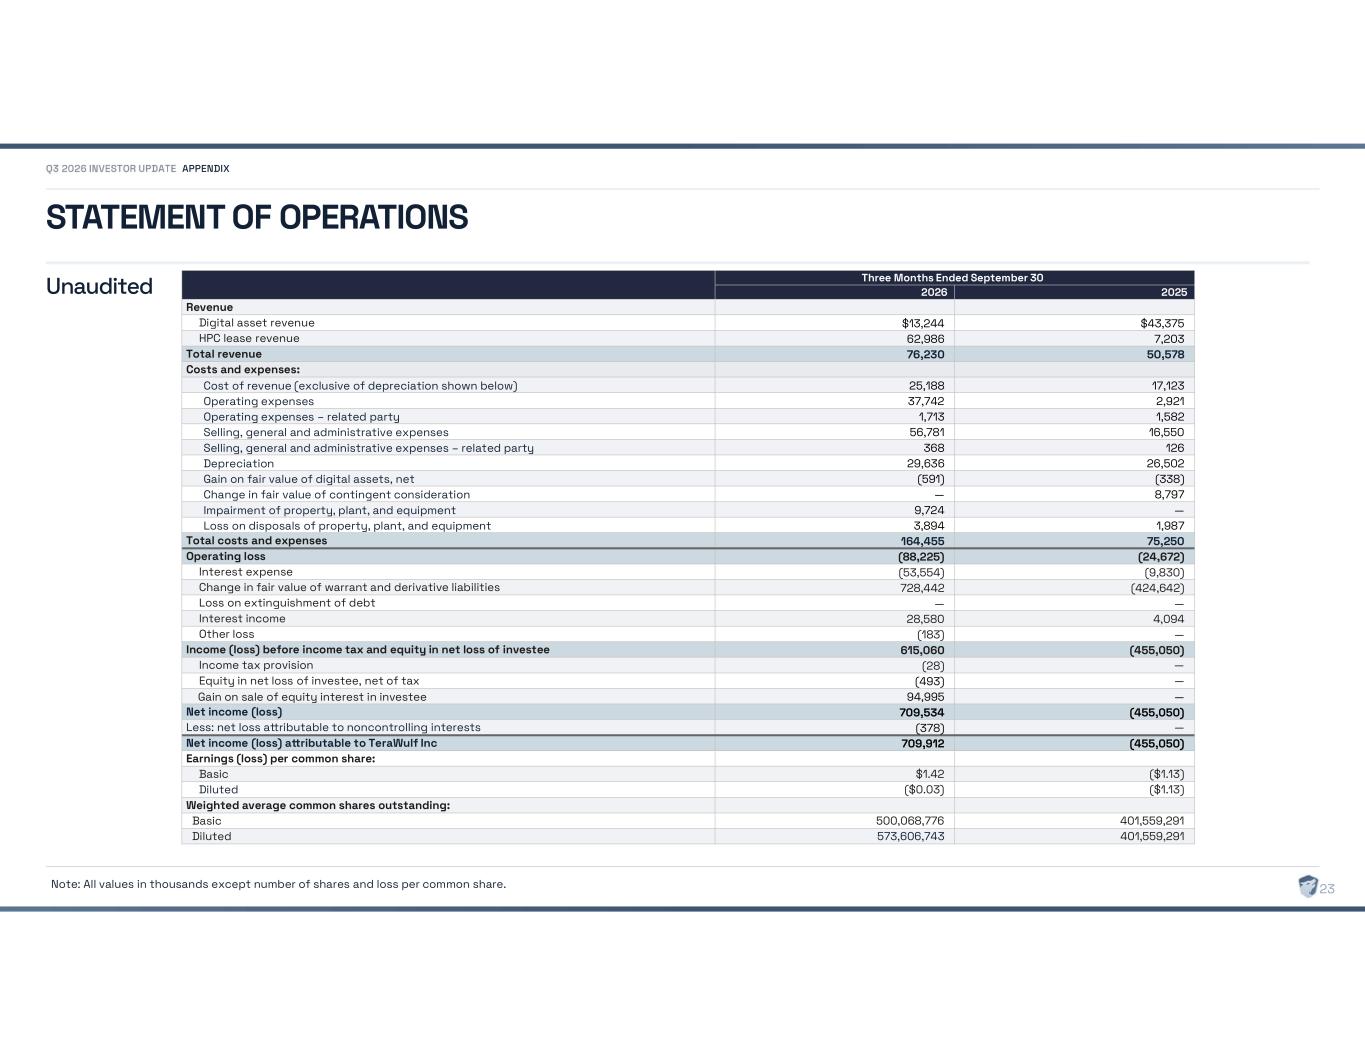
STATEMENT OF OPERATIONS APPENDIX 23 Three Months Ended September 30 ` 2025 2026 Revenue $43,375 $13,244 Digital asset revenue 7,203 62,986 HPC lease revenue 50,578 76,230 Total revenue Costs and expenses: 17,123 25,188 Cost of revenue (exclusive of depreciation shown below) 2,921 37,742 Operating expenses 1,582 1,713 Operating expenses – related party 16,550 56,781 Selling, general and administrative expenses 126 368 Selling, general and administrative expenses – related party 26,502 29,636 Depreciation (338) (591) Gain on fair value of digital assets, net 8,797 — Change in fair value of contingent consideration — 9,724 Impairment of property, plant, and equipment 1,987 3,894 Loss on disposals of property, plant, and equipment 75,250 164,455 Total costs and expenses (24,672) (88,225) Operating loss (9,830) (53,554) Interest expense (424,642) 728,442 Change in fair value of warrant and derivative liabilities — — Loss on extinguishment of debt 4,094 28,580 Interest income — (183) Other loss (455,050) 615,060 Income (loss) before income tax and equity in net loss of investee — (28) Income tax provision — (493) Equity in net loss of investee, net of tax — 94,995 Gain on sale of equity interest in investee (455,050) 709,534 Net income (loss) — (378) Less: net loss a ributable to noncontrolling interests (455,050) 709,912 Net income (loss) a ributable to TeraWulf Inc Earnings (loss) per common share: ($1.13) $1.42 Basic ($1.13) ($0.03) Diluted Weighted average common shares outstanding: 401,559,291 500,068,776 Basic 401,559,291 573,606,743 Diluted Note: All values in thousands except number of shares and loss per common share. Unaudited
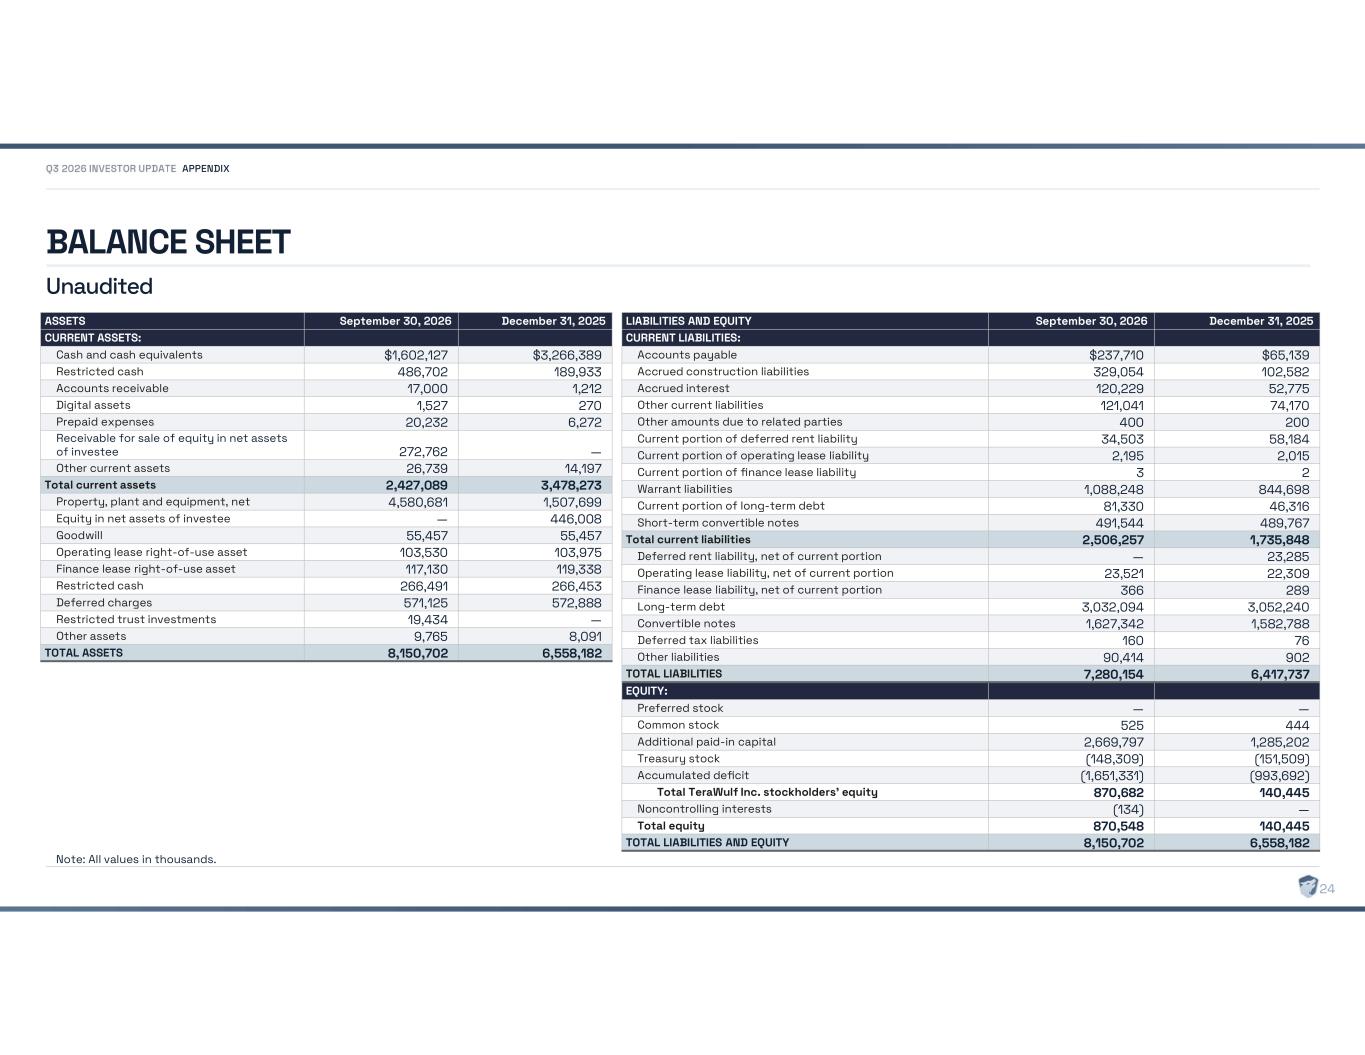
BALANCE SHEET APPENDIX 24 December 31, 2025 September 30, 2026 ASSETS CURRENT ASSETS: $3,266,389 $1,602,127 Cash and cash equivalents 189,933 486,702 Restricted cash 1,212 17,000 Accounts receivable 270 1,527 Digital assets 6,272 20,232 Prepaid expenses — 272,762 Receivable for sale of equity in net assets of investee 14,197 26,739 Other current assets 3,478,273 2,427,089 Total current assets 1,507,699 4,580,681 Property, plant and equipment, net 446,008 — Equity in net assets of investee 55,457 55,457 Goodwill 103,975 103,530 Operating lease right-of-use asset 119,338 117,130 Finance lease right-of-use asset 266,453 266,491 Restricted cash 572,888 571,125 Deferred charges — 19,434 Restricted trust investments 8,091 9,765 Other assets 6,558,182 8,150,702 TOTAL ASSETS December 31, 2025 September 30, 2026 LIABILITIES AND EQUITY CURRENT LIABILITIES: $65,139 $237,710 Accounts payable 102,582 329,054 Accrued construction liabilities 52,775 120,229 Accrued interest 74,170 121,041 Other current liabilities 200 400 Other amounts due to related parties 58,184 34,503 Current portion of deferred rent liability 2,015 2,195 Current portion of operating lease liability 2 3 Current portion of finance lease liability 844,698 1,088,248 Warrant liabilities 46,316 81,330 Current portion of long-term debt 489,767 491,544 Short-term convertible notes 1,735,848 2,506,257 Total current liabilities 23,285 — Deferred rent liability, net of current portion 22,309 23,521 Operating lease liability, net of current portion 289 366 Finance lease liability, net of current portion 3,052,240 3,032,094 Long-term debt 1,582,788 1,627,342 Convertible notes 76 160 Deferred tax liabilities 902 90,414 Other liabilities 6,417,737 7,280,154 TOTAL LIABILITIES EQUITY: — — Preferred stock 444 525 Common stock 1,285,202 2,669,797 Additional paid-in capital (151,509) (148,309) Treasury stock (993,692) (1,651,331) Accumulated deficit 140,445 870,682 Total TeraWulf Inc. stockholders’ equity — (134) Noncontrolling interests 140,445 870,548 Total equity 6,558,182 8,150,702 TOTAL LIABILITIES AND EQUITY Note: All values in thousands. Unaudited
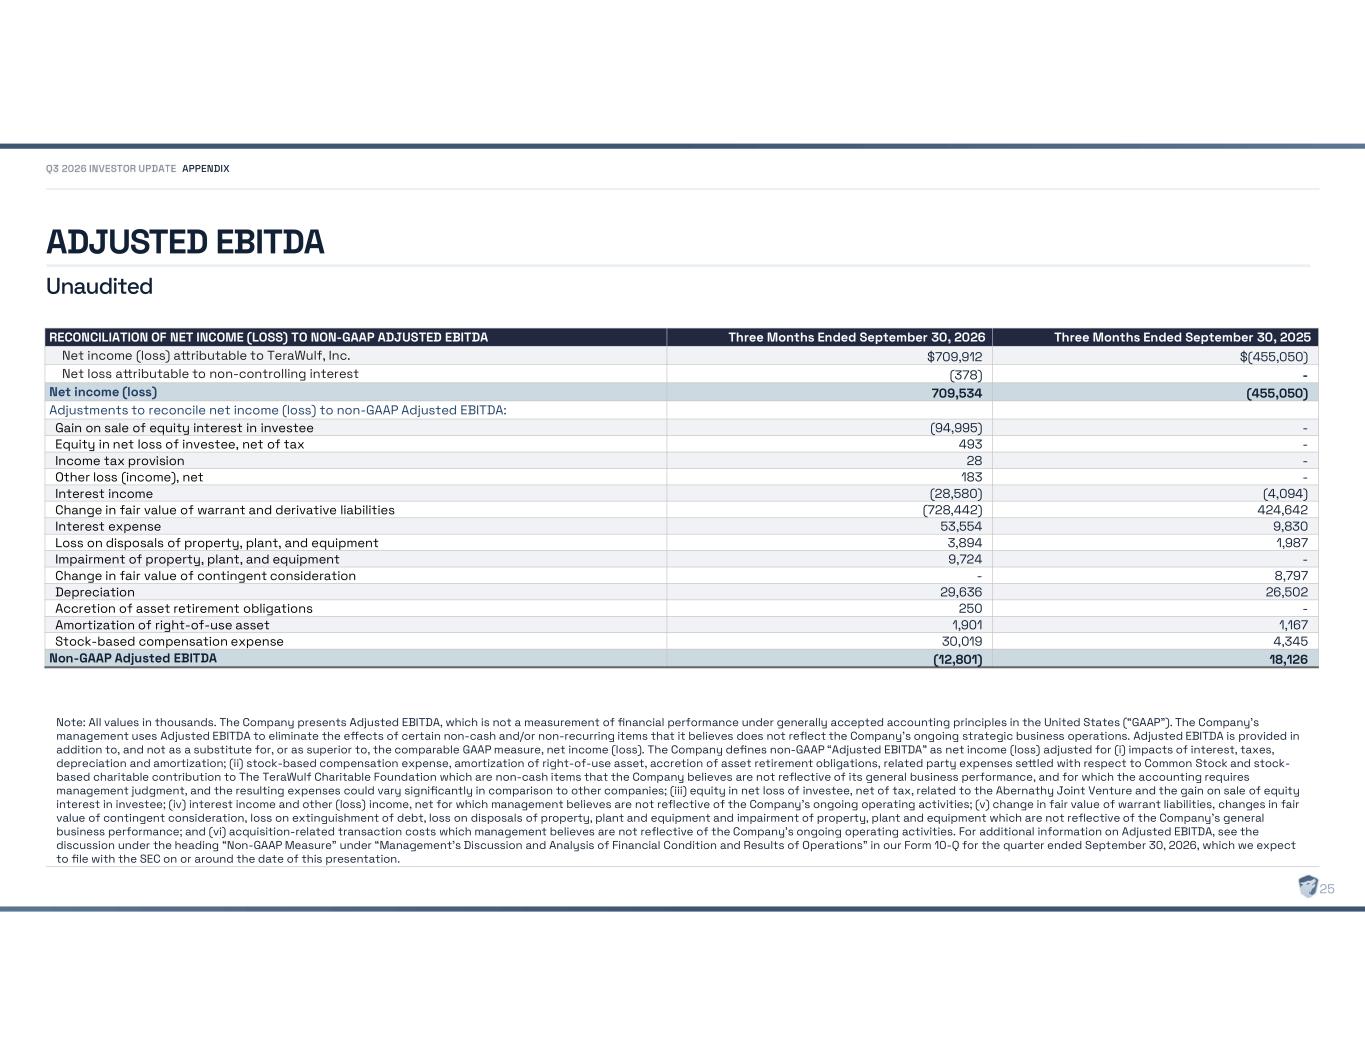
ADJUSTED EBITDA Note: All values in thousands. The Company presents Adjusted EBITDA, which is not a measurement of financial performance under generally accepted accounting principles in the United States (“GAAP”). The Company's management uses Adjusted EBITDA to eliminate the effects of certain non-cash and/or non-recurring items that it believes does not reflect the Company's ongoing strategic business operations. Adjusted EBITDA is provided in addition to, and not as a substitute for, or as superior to, the comparable GAAP measure, net income (loss). The Company defines non-GAAP “Adjusted EBITDA” as net income (loss) adjusted for (i) impacts of interest, taxes, depreciation and amortization; (ii) stock-based compensation expense, amortization of right-of-use asset, accretion of asset retirement obligations, related party expenses se led with respect to Common Stock and stock- based charitable contribution to The TeraWulf Charitable Foundation which are non-cash items that the Company believes are not reflective of its general business performance, and for which the accounting requires management judgment, and the resulting expenses could vary significantly in comparison to other companies; (iii) equity in net loss of investee, net of tax, related to the Abernathy Joint Venture and the gain on sale of equity interest in investee; (iv) interest income and other (loss) income, net for which management believes are not reflective of the Company’s ongoing operating activities; (v) change in fair value of warrant liabilities, changes in fair value of contingent consideration, loss on extinguishment of debt, loss on disposals of property, plant and equipment and impairment of property, plant and equipment which are not reflective of the Company’s general business performance; and (vi) acquisition-related transaction costs which management believes are not reflective of the Company’s ongoing operating activities. For additional information on Adjusted EBITDA, see the discussion under the heading “Non-GAAP Measure” under “Management’s Discussion and Analysis of Financial Condition and Results of Operations” in our Form 10-Q for the quarter ended September 30, 2026, which we expect to file with the SEC on or around the date of this presentation. APPENDIX 25 Three Months Ended September 30, 2025 Three Months Ended September 30, 2026 RECONCILIATION OF NET INCOME (LOSS) TO NON-GAAP ADJUSTED EBITDA $(455,050) $709,912 Net income (loss) a ributable to TeraWulf, Inc. - (378) Net loss a ributable to non-controlling interest (455,050) 709,534 Net income (loss) Adjustments to reconcile net income (loss) to non-GAAP Adjusted EBITDA: - (94,995) Gain on sale of equity interest in investee - 493 Equity in net loss of investee, net of tax - 28 Income tax provision - 183 Other loss (income), net (4,094) (28,580) Interest income 424,642 (728,442) Change in fair value of warrant and derivative liabilities 9,830 53,554 Interest expense 1,987 3,894 Loss on disposals of property, plant, and equipment - 9,724 Impairment of property, plant, and equipment 8,797 - Change in fair value of contingent consideration 26,502 29,636 Depreciation - 250 Accretion of asset retirement obligations 1,167 1,901 Amortization of right-of-use asset 4,345 30,019 Stock-based compensation expense 18,126 (12,801) Non-GAAP Adjusted EBITDA Unaudited
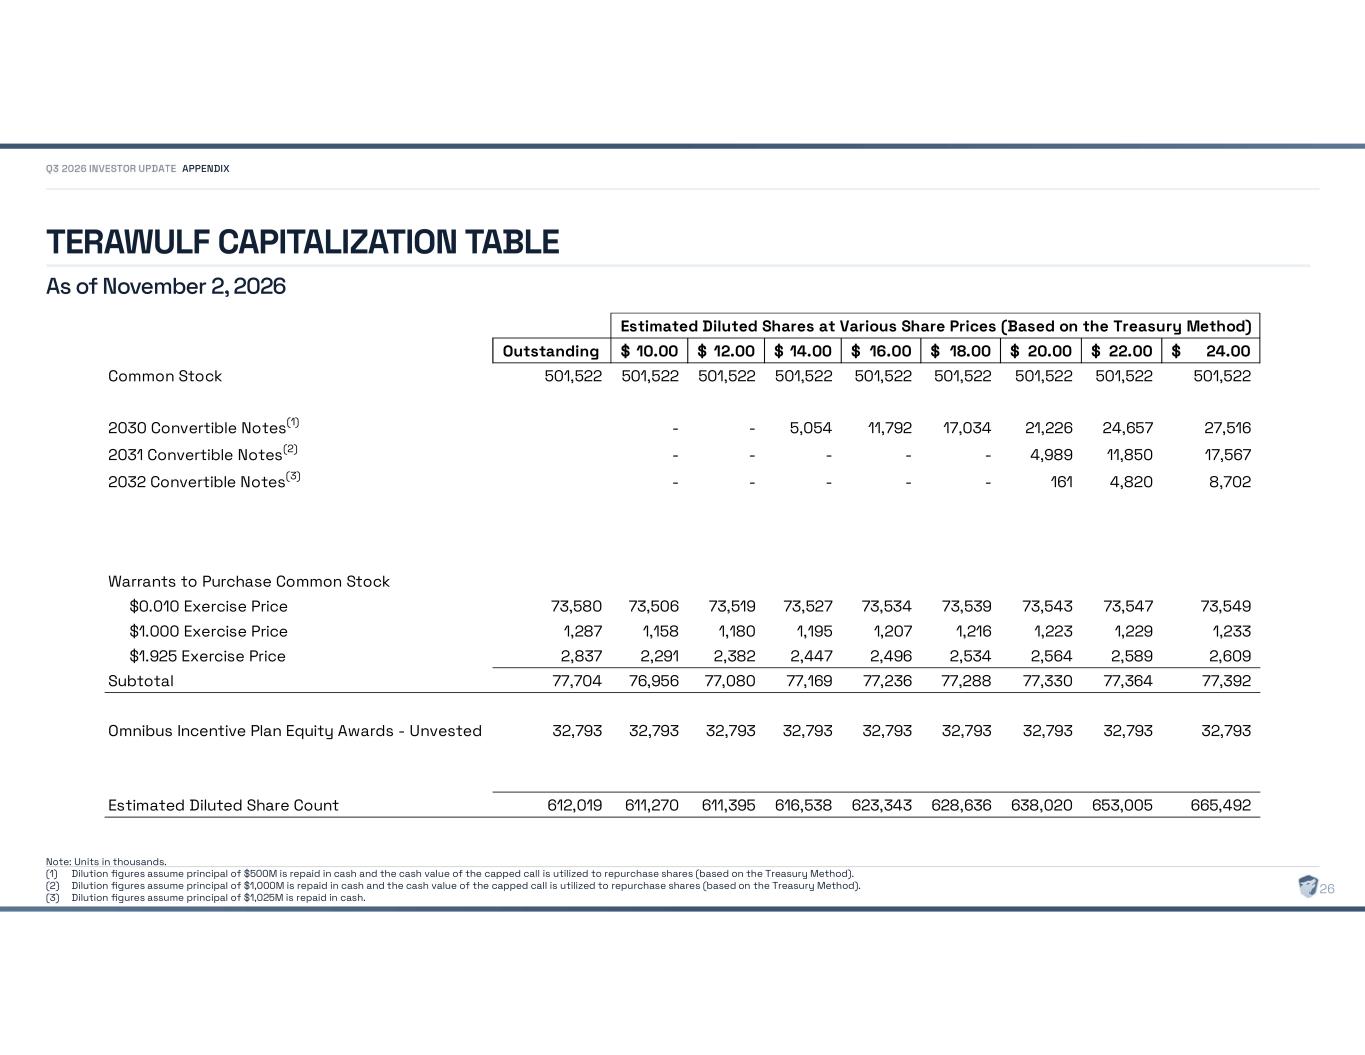
TERAWULF CAPITALIZATION TABLE As of November 2, 2026 Note: Units in thousands. (1) Dilution figures assume principal of $500M is repaid in cash and the cash value of the capped call is utilized to repurchase shares (based on the Treasury Method). (2) Dilution figures assume principal of $1,000M is repaid in cash and the cash value of the capped call is utilized to repurchase shares (based on the Treasury Method). (3) Dilution figures assume principal of $1,025M is repaid in cash. APPENDIX 26 Estimated Diluted Shares at Various Share Prices (Based on the Treasury Method) Outstanding 10.00$ 12.00$ 14.00$ 16.00$ 18.00$ 20.00$ 22.00$ 24.00$ Common Stock 501,522 501,522 501,522 501,522 501,522 501,522 501,522 501,522 501,522 2030 Convertible Notes(1) - - 5,054 11,792 17,034 21,226 24,657 27,516 2031 Convertible Notes(2) - - - - - 4,989 11,850 17,567 2032 Convertible Notes(3) - - - - - 161 4,820 8,702 Warrants to Purchase Common Stock $0.010 Exercise Price 73,580 73,506 73,519 73,527 73,534 73,539 73,543 73,547 73,549 $1.000 Exercise Price 1,287 1,158 1,180 1,195 1,207 1,216 1,223 1,229 1,233 $1.925 Exercise Price 2,837 2,291 2,382 2,447 2,496 2,534 2,564 2,589 2,609 Subtotal 77,704 76,956 77,080 77,169 77,236 77,288 77,330 77,364 77,392 Omnibus Incentive Plan Equity Awards - Unvested 32,793 32,793 32,793 32,793 32,793 32,793 32,793 32,793 32,793 Estimated Diluted Share Count 612,019 611,270 611,395 616,538 623,343 628,636 638,020 653,005 665,492